BMI Categories Around the World: WHO, CDC and the Asian Action Points
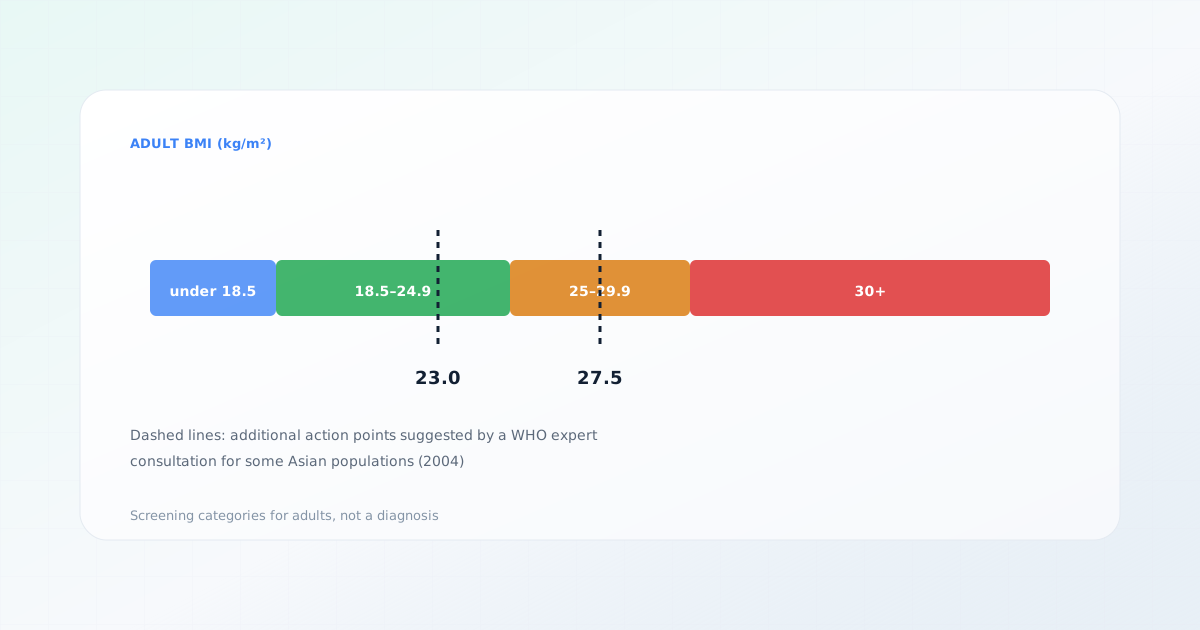
The adult BMI categories used by the WHO and the CDC are the same, but the WHO has also suggested additional action points at 23.0 and 27.5 for some Asian populations. Here is how the categories work, in kilograms and in pounds.
How BMI is calculated, in either unit system
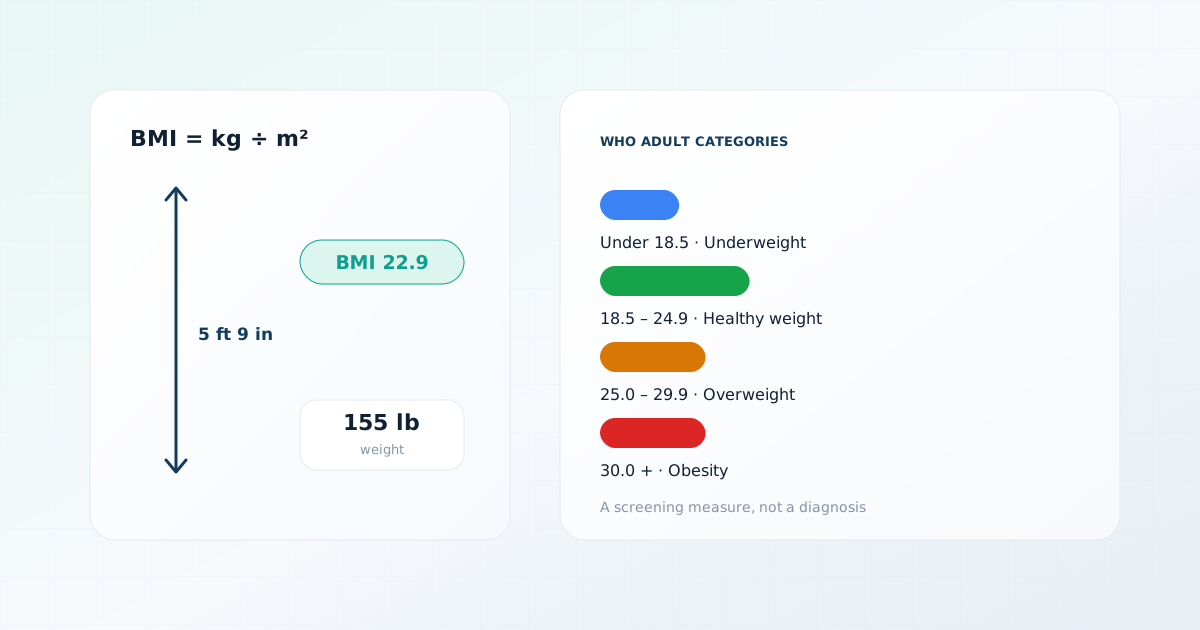
Body mass index is a person’s weight in kilograms divided by the square of their height in meters. A person who weighs 70 kilograms and is 1.75 meters tall has a BMI of 70 divided by 3.0625, which is 22.9. In US customary units the formula multiplies weight in pounds by 703 and divides by height in inches squared, and the result is the same number.
Imperial entries on a calculator are converted to metric first, using 1 pound equals 0.45359237 kilograms and 1 inch equals 2.54 centimeters, so the same underlying calculation applies whichever unit you choose. That is also why the figure you get from a pounds-and-inches formula and from a kilograms-and-meters one should agree to rounding.
It helps to remember that the square in the formula is why BMI is not proportional to weight. Doubling height quadruples the denominator, which is how the measure tries to adjust for body size. It is also why small errors in height matter: a height that is two centimeters too low raises the calculated BMI by roughly half a point for a 70 kilogram adult, and by more at higher weights, so measuring height carefully is worth the effort.
Try the calculatorCalculate BMI in US or metric unitsThe standard adult categories
The World Health Organization’s adult classification, which the Centers for Disease Control and Prevention also uses for adults, divides BMI into bands. The WHO subdivides obesity into classes at 35.0 and 40.0.
| BMI (kg/m²) | Category |
|---|---|
| Below 18.5 | Underweight |
| 18.5 to 24.9 | Within the range most guidance treats as healthy |
| 25.0 to 29.9 | Overweight |
| 30.0 to 34.9 | Obesity class I |
| 35.0 to 39.9 | Obesity class II |
| 40.0 and above | Obesity class III |
The CDC is explicit that BMI is a screening measure, not a diagnostic tool. A BMI in a higher category is a reason for a clinician to look more closely at weight distribution, blood pressure, glucose, lipids and other factors, not a finding in itself.
The classification also differs in wording between sources. Some documents call the 25.0 to 29.9 band pre-obese and others call it overweight, and the label for the 18.5 to 24.9 band varies from normal weight to healthy weight. This site uses descriptions that avoid the word normal, because it reads as a verdict on the person and not as a description of a range.
What the category boundaries look like in pounds
Seeing the boundaries as weights at a fixed height makes the categories concrete. The table uses a height of 5 feet 7 inches, which is 67 inches, and the formula weight in pounds equals BMI times height in inches squared divided by 703.
| BMI | Weight (lb) | Where it falls |
|---|---|---|
| 18.5 | 118.1 | Lower bound of the 18.5 to 24.9 band |
| 23.0 | 146.9 | WHO suggested action point for some Asian populations |
| 25.0 | 159.6 | Overweight begins |
| 27.5 | 175.6 | WHO suggested higher action point for some Asian populations |
| 30.0 | 191.6 | Obesity class I begins |
The width of the 18.5 to 24.9 band at this height is about 41 pounds, which is a reminder of how much healthy variation the category tolerates. Moving a few pounds across a boundary does not change a person’s health, even though it changes the label.
A second thing the table shows is how little the boundaries correspond to any change in the body. Gaining or losing five pounds near a boundary changes the label and does not change the person. For that reason it is more informative to watch the direction of change over months, together with a waist measurement, than to focus on which side of a line a single reading falls.
The WHO’s additional action points for some Asian populations
In 2004, a WHO expert consultation published its findings in The Lancet under the title "Appropriate body-mass index for Asian populations and its implications for policy and intervention strategies". It reviewed evidence that in many Asian populations the risks of type 2 diabetes and cardiovascular disease rise at lower BMI values than in European-ancestry populations, in part because of differences in body composition and fat distribution.
The consultation did not replace the standard categories. It suggested additional public health action points at a BMI of 23.0 and 27.5 for some Asian populations, to flag people at increased risk earlier. Several countries have adopted their own cut-points in light of this, so the national guidance a person follows may differ.
In practice this means that a person with a BMI of 24 in a population where risk is raised at lower values could be in the standard healthy band and still be at or near an action point. It is one more reason why a BMI category should open a conversation with a clinician about other measurements, and not close it. Waist-to-height ratio, blood pressure, glucose and lipid results are the measurements that usually accompany it.
- The additional points are designed for public health action in populations, and they do not label an individual as having a condition.
- They apply to some Asian populations, and the evidence differs between groups, so not every person of Asian ancestry is described by them.
- The standard 18.5 to 24.9 band is still what the WHO’s global classification uses.
A reason to look at more than BMI
What BMI cannot tell you
- It cannot distinguish muscle from fat, so muscular people are frequently placed in a higher category despite a low body fat.
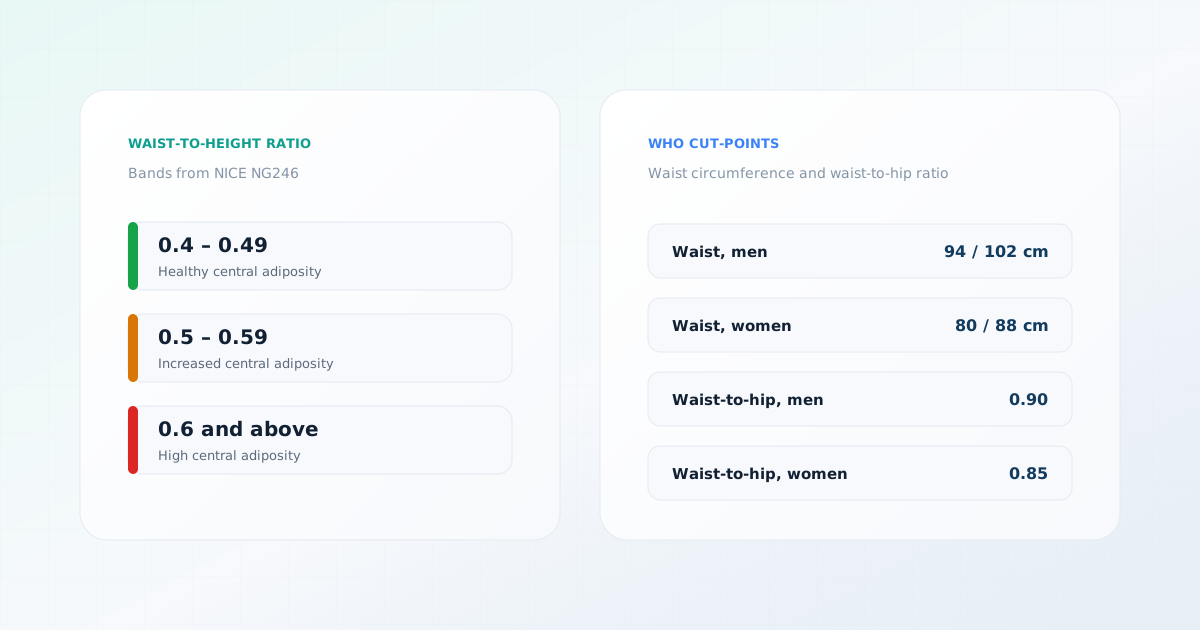
- It says nothing about where fat is carried. Waist circumference and waist-to-height ratio address abdominal fat directly.
- The WHO cut-points were derived largely from European-ancestry populations, which is the reason for the additional Asian action points.
- The categories do not apply to children and adolescents, who are assessed against age- and sex-specific percentile charts.
- It is not validated during pregnancy or breastfeeding, for competitive athletes, for older adults with significant muscle loss, or for people with limb amputation or fluid retention.
Recent US guidance has also moved toward treating BMI as one input among several. The 2026 AHA/ACC/ADA/ASN guideline on cardiovascular-kidney-metabolic syndrome considers weight alongside blood pressure, lipids, glucose and kidney function, and does not treat a BMI category as sufficient by itself.
Taken together, the categories are best understood as a shared vocabulary that lets clinicians and public health agencies talk about weight consistently, with all the simplifications that implies, and not as a precise statement about any one person.
Frequently asked questions
Sources
This page is based on the following sources. Each was reviewed on the access date shown.
- A healthy lifestyle — WHO recommendations(opens in a new tab)
World Health Organization
Government health agencyAccessed September 27, 2026
- About Adult BMI(opens in a new tab)
Centers for Disease Control and Prevention
Government health agencyAccessed September 27, 2026
- Appropriate body-mass index for Asian populations and its implications for policy and intervention strategies(opens in a new tab)
The Lancet (WHO Expert Consultation)
Systematic reviewPublished January 10, 2004Accessed September 27, 2026
- 2026 AHA/ACC/ADA/ASN Guideline for the Prevention, Detection, Evaluation, and Management of Cardiovascular-Kidney-Metabolic Syndrome(opens in a new tab)
Journal of the American College of Cardiology
Clinical guidelinePublished June 9, 2026Accessed October 1, 2026DOI 10.1016/j.jacc.2026.03.056