What Is BMI and What Does It Actually Tell You?
BMI is weight divided by height squared — a population screening tool invented in the 1830s, not a measure of an individual’s health. It cannot distinguish muscle from fat, says nothing about where fat is carried, and in 2026 US guidelines it is explicitly no longer enough on its own.
The formula, and where it came from
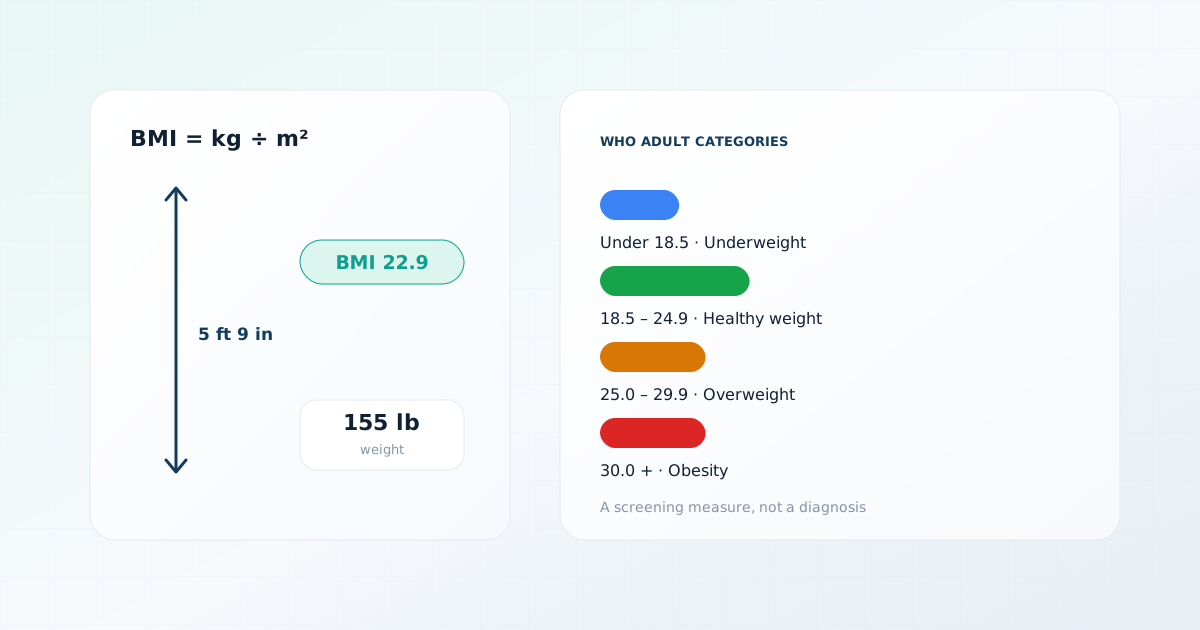
Body mass index is weight in kilograms divided by the square of height in meters. Someone weighing 70 kg at 1.75 m has a BMI of 70 ÷ (1.75 × 1.75), which is 22.9.
- BMI
- weight (kg) ÷ height (m)². In imperial units the equivalent is weight (lb) ÷ height (in)² × 703, where 703 is simply the unit-conversion constant.
The history explains a lot about its limitations. The index was devised in the 1830s by Adolphe Quetelet, a Belgian mathematician and astronomer, as part of a statistical project describing the characteristics of populations. Quetelet was explicit that he was studying the average person as a statistical construct. He was not proposing a clinical tool, and he had no interest in individual assessment.
It acquired its modern name and role in 1972, when the physiologist Ancel Keys evaluated several height-weight indices and found Quetelet’s the best available proxy for body fat in population studies. That is the origin of BMI as a screening measure — chosen because it correlated reasonably well with body fat *across groups* and needed only a scale and a tape measure.
The squared term is an approximation
The categories
| Category | BMI range |
|---|---|
| Underweight | Below 18.5 |
| Healthy weight | 18.5 – 24.9 |
| Overweight | 25.0 – 29.9 |
| Obesity class I | 30.0 – 34.9 |
| Obesity class II | 35.0 – 39.9 |
| Obesity class III | 40.0 and above |
These boundaries are not natural discontinuities. There is no biological threshold at which 24.9 becomes meaningfully different from 25.0 — the numbers are round figures chosen to divide a continuous distribution into communicable groups. A BMI of 24.9 and a BMI of 25.1 describe essentially the same body.
Children and adolescents are assessed entirely differently, against age- and sex-specific percentile charts, because body composition changes substantially through growth. Applying adult categories to anyone under 18 gives a meaningless answer.
BMI alone is no longer the standard
Most of the criticism on this page is old news to the people who write guidelines. What is new is that the guidelines have now been rewritten around it.
In January 2025 a Lancet Diabetes & Endocrinology Commission proposed splitting obesity in two. *Clinical obesity* is excess body fat that is already causing measurable problems in organs or in day-to-day function. *Preclinical obesity* is excess body fat without that damage, carrying increased future risk. The Commission’s central argument was that BMI alone cannot tell the two apart, and should not by itself diagnose either — a direct measure of body fat, or at minimum a second measurement such as waist circumference, belongs alongside it.
In June 2026 that thinking reached US practice. The AHA, ACC, American Diabetes Association and American Society of Nephrology published the first guideline on cardiovascular-kidney-metabolic syndrome, which retired and replaced the 2013 obesity guideline. It treats excess weight, blood pressure, lipids, blood glucose and kidney function as one connected syndrome staged from 0 to 4, rather than as five separate numbers each with its own chart.
What this means when you read your own BMI
The muscle problem
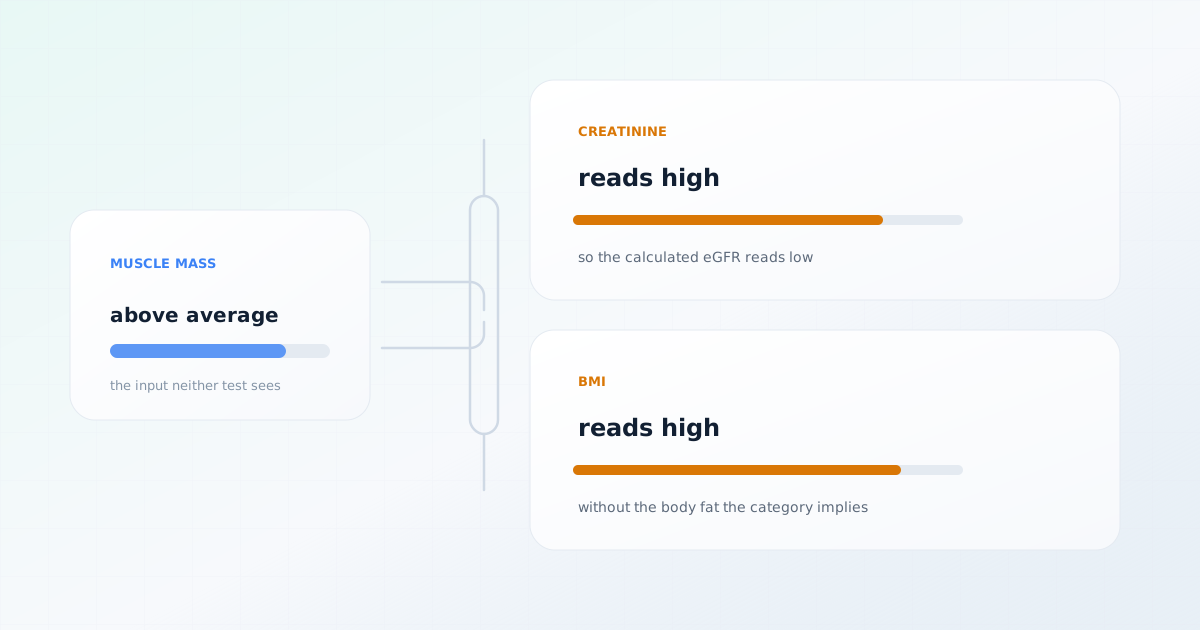
BMI’s most obvious limitation is that it knows only two facts about you, neither of which is what it is trying to estimate. It measures weight relative to height. Body fat is what it is used as a proxy for. Muscle weighs more than fat for a given volume, so anyone with substantial muscle mass is pushed up the scale.
| Person | Weight | BMI | BMI category | Body fat |
|---|---|---|---|---|
| Trained rugby player | 100 kg | 30.9 | Obesity class I | Around 12% |
| Sedentary adult | 82 kg | 25.3 | Overweight | Around 30% |
| Older adult with muscle loss | 68 kg | 21.0 | Healthy weight | Around 32% |
The third row describes a pattern sometimes called sarcopenic obesity — low muscle mass alongside a relatively high proportion of body fat, with a BMI that looks entirely reassuring. It becomes more common with age and is exactly the situation BMI is worst at detecting.
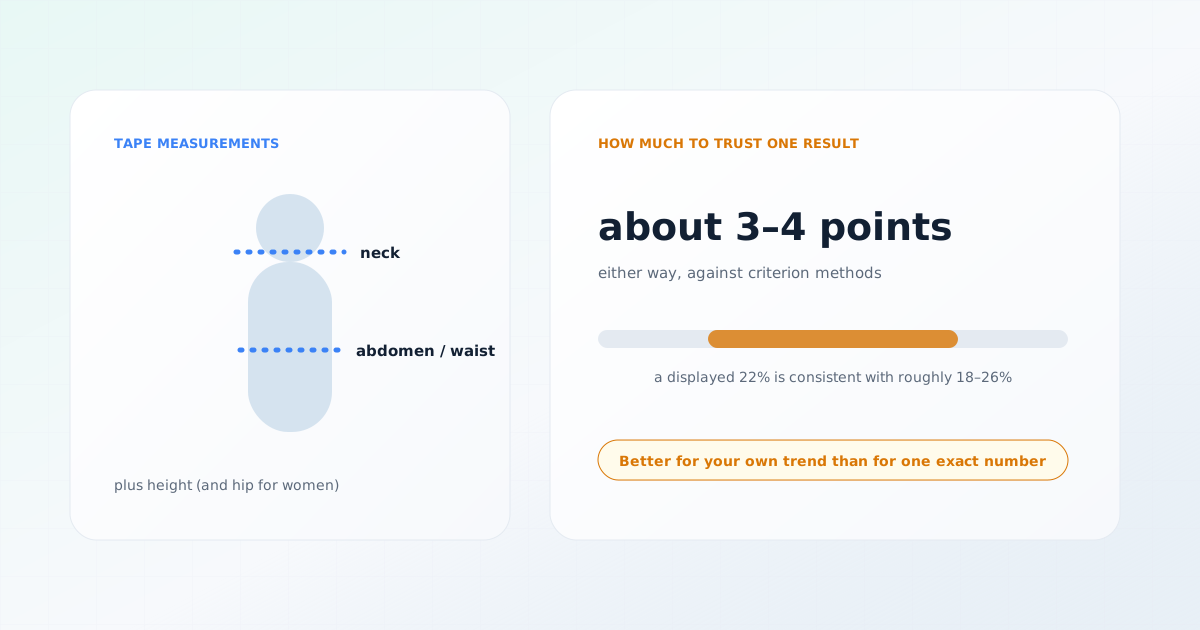
A circumference-based body fat estimate separates the two to a degree BMI cannot, though it comes with wide error bars of its own — around three to four percentage points against laboratory methods, which is why it is far better used to track your own trend than to pin down a single figure.
Try the calculatorEstimate body fat percentage from circumferencesWhere fat is carried matters, and BMI cannot see it
Not all body fat carries the same metabolic significance. Visceral fat, packed around the organs in the abdomen, is far more strongly associated with insulin resistance, raised triglycerides and cardiovascular risk than subcutaneous fat under the skin of the hips and thighs.
Two people with an identical BMI of 28 can have quite different distributions — one carrying weight around the middle, the other around the hips — with different implications. BMI cannot distinguish them at all, because it has no information about shape.
- Waist circumference, measured at the midpoint between the lowest rib and the top of the hip bone, captures abdominal fat directly. Commonly cited thresholds are above 102 cm in men and 88 cm in women, with lower thresholds recommended for some Asian populations.
- Waist-to-height ratio is simpler still, and increasingly favored: keeping waist circumference below half your height is a widely quoted rule of thumb that needs no reference table and works across heights.
- Waist-to-hip ratio adds information about distribution pattern.
A tape measure adds more than a better scale
The cut-points were not calibrated for everyone
The standard BMI thresholds were derived largely from populations of European ancestry. The relationship between BMI and health risk is not identical across populations, and a WHO expert consultation examined this directly.
It found that in many Asian populations, cardiometabolic risk — including type 2 diabetes and cardiovascular disease — begins to rise at a lower BMI than the standard cut-points imply, reflecting differences in average body composition and fat distribution at a given BMI. The consultation proposed additional action points at 23.0 and 27.5, and several countries have adopted adjusted national ranges on that basis.
The general point is broader than any one population: BMI thresholds are conventions calibrated against particular reference groups, and they travel less well than the apparent precision of the number suggests.
Screening versus diagnosis
This is the distinction that resolves most confusion about BMI. A screening measure sorts a population cheaply into groups that may warrant a closer look. A diagnostic measure establishes whether a particular individual has a particular condition. BMI is the first and not the second.
It is genuinely good at what it was built for. Applied across a population, BMI correlates well enough with body fat and with health outcomes to be useful for public health surveillance, for comparing groups over time, and as a cheap first filter. It requires only height and weight, which makes it practical at a scale nothing else matches.
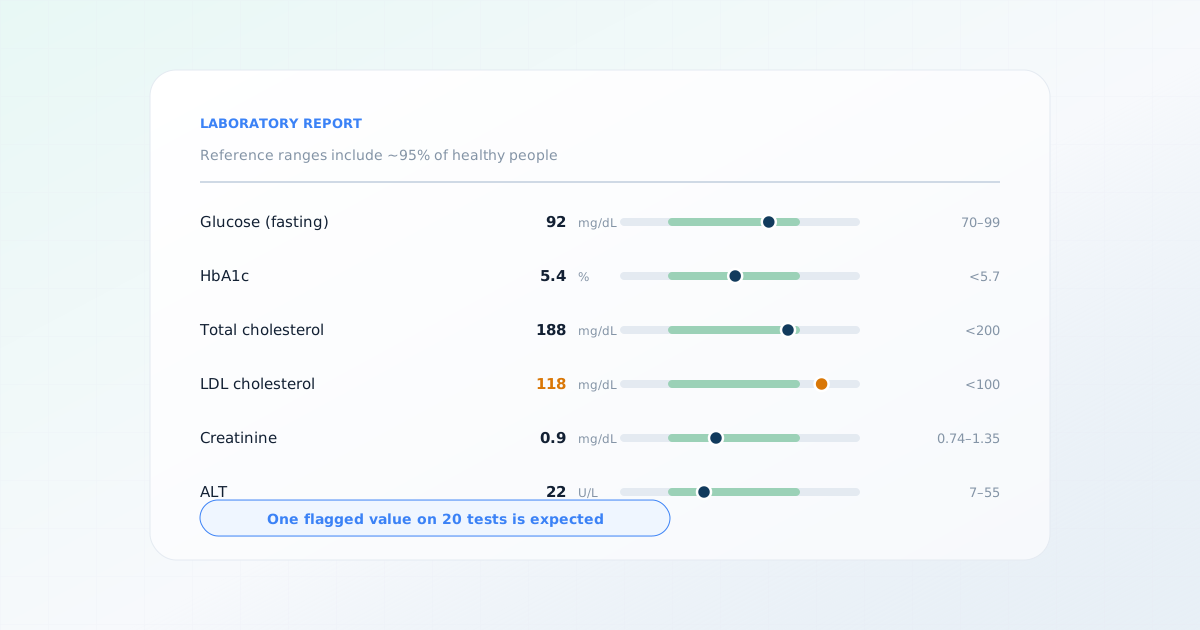
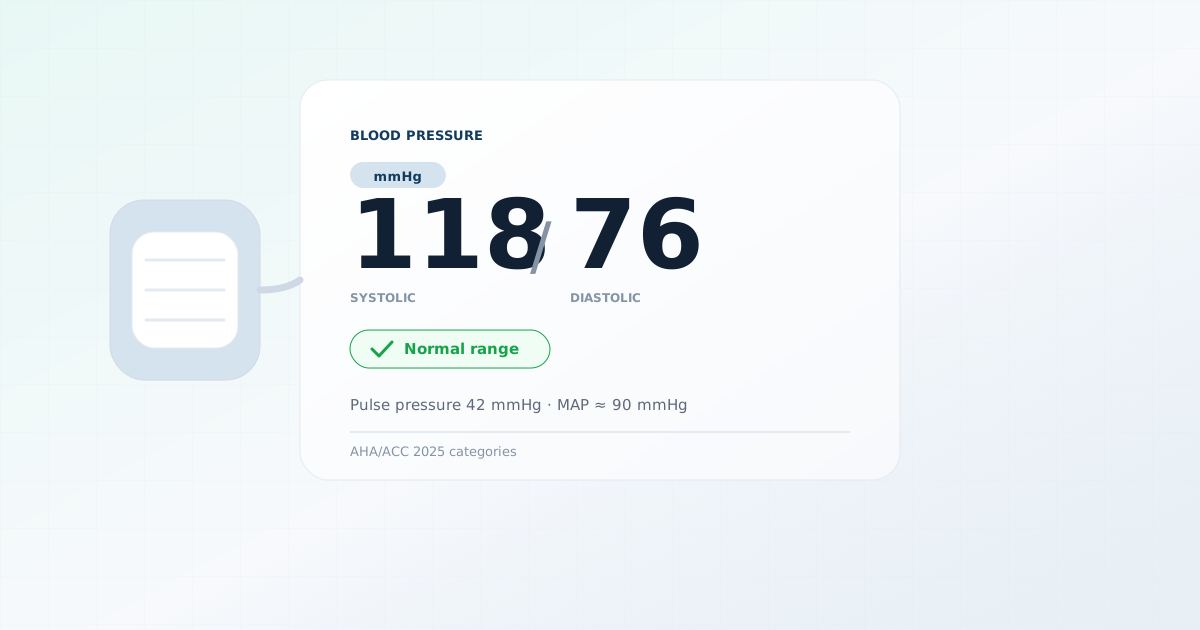
What it cannot do is tell an individual whether their weight is affecting their health. That assessment looks at waist measurement, blood pressure, a lipid panel, glucose or HbA1c, kidney function, liver tests, physical function, family history, and how the person actually feels. The 2026 CKM guideline is essentially that list, written down and staged. BMI is one line in it.
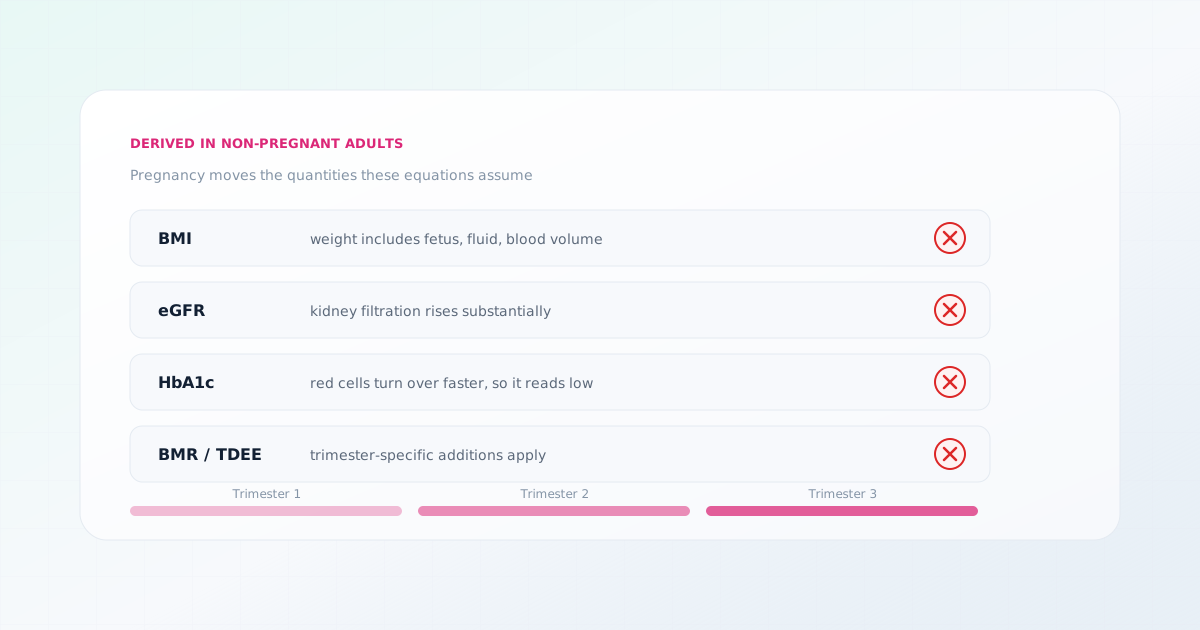
Where BMI does not apply at all
Using BMI sensibly
- Treat it as one data point, not a verdict. It is a ratio of two measurements, and it carries exactly that much information.
- Measure your waist as well. It takes a minute and adds the dimension BMI is missing.
- Pay more attention to trend than to absolute value. A BMI rising steadily over five years says more than any single reading.
- Look at the measurements that describe what is actually happening metabolically — blood pressure, lipids, glucose — rather than inferring them from BMI.
- If your BMI category seems inconsistent with your body, it probably is. Muscle mass, frame size and fat distribution all explain real mismatches.
The reason BMI persists despite well-understood limitations is not that anyone thinks it is excellent. It is that it is free, universally available, and better than nothing across a population. Knowing precisely what it does and does not measure is what makes it usable without being misled by it.
One related number is worth knowing about mainly so you do not mistake it for a goal. "Ideal body weight" formulas such as Devine and Robinson were built in the 1970s for calculating drug doses, not for setting a target on a scale. They are still used that way in clinical pharmacy, and still have no business being read as a weight anyone should be aiming for.
Try the calculatorSee what "ideal body weight" formulas were actually built forFrequently asked questions
Sources
This page is based on the following sources. Each was reviewed on the access date shown.
- 2026 AHA/ACC/ADA/ASN Guideline for the Prevention, Detection, Evaluation, and Management of Cardiovascular-Kidney-Metabolic Syndrome(opens in a new tab)
Journal of the American College of Cardiology
Clinical guidelinePublished June 9, 2026Accessed October 1, 2026DOI 10.1016/j.jacc.2026.03.056
- Definition and diagnostic criteria of clinical obesity(opens in a new tab)
The Lancet Diabetes & Endocrinology (Commission)
Systematic reviewPublished January 14, 2025Accessed October 1, 2026DOI 10.1016/S2213-8587(24)00316-4
- About Adult BMI(opens in a new tab)
Centers for Disease Control and Prevention
Government health agencyAccessed September 27, 2026
- A healthy lifestyle — WHO recommendations(opens in a new tab)
World Health Organization
Government health agencyAccessed September 27, 2026
- Appropriate body-mass index for Asian populations and its implications for policy and intervention strategies(opens in a new tab)
The Lancet (WHO Expert Consultation)
Systematic reviewPublished January 10, 2004Accessed September 27, 2026
- Overweight and obesity management: identifying and assessing overweight, obesity and central adiposity (NG246)(opens in a new tab)
National Institute for Health and Care Excellence (NICE)
Clinical guidelinePublished January 14, 2025Accessed September 27, 2026