How to Read Common Blood Test Results
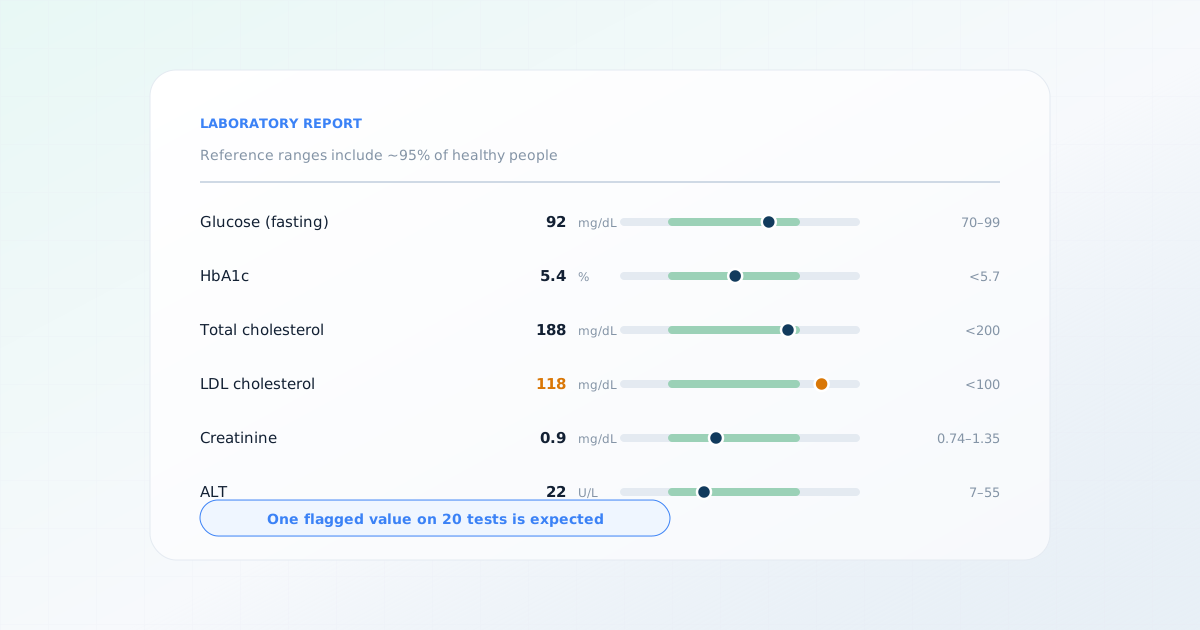
A reference range is built to include about 95% of a healthy population, which means roughly one result in twenty falls outside it by design. This guide explains what the most common blood tests measure, and how clinicians read a panel as a pattern rather than a checklist.
What a reference range actually is
This is the single most useful thing to understand before reading any laboratory report, and it is almost never explained on the report itself.
A reference range is established by measuring a substance in a large group of people considered healthy, then taking the interval that contains the middle 95% of those results. The lowest 2.5% and the highest 2.5% fall outside — and those people were healthy. The range is a statistical description of a population, not a boundary between well and unwell.
The arithmetic of a flagged result
Two further consequences follow. A result just outside the range is usually less significant than it looks, because the boundary is a convention rather than a cliff. And a result comfortably inside the range is not proof of health — a value can be inside the range and still represent a substantial change from your own previous level.
Why ranges and units differ between reports
Reference ranges are specific to the laboratory that produced them. Different analysers and different methods measure the same substance slightly differently, so each laboratory establishes its own ranges against its own equipment. This is why the range printed on your report may not match one you find elsewhere, and why comparing results from two laboratories is less reliable than tracking results from one.
Units differ by country, and this causes real confusion. The same measurement can appear as a completely different number.
| Test | United States | Most other countries | Conversion |
|---|---|---|---|
| Glucose | mg/dL | mmol/L | Divide mg/dL by 18.0182 |
| Cholesterol fractions | mg/dL | mmol/L | Divide mg/dL by 38.67 |
| Triglycerides | mg/dL | mmol/L | Divide mg/dL by 88.57 |
| Creatinine | mg/dL | µmol/L | Multiply mg/dL by 88.42 |
| HbA1c | % | mmol/mol | (% − 2.15) × 10.929 |
Glucose and HbA1c
- Glucose
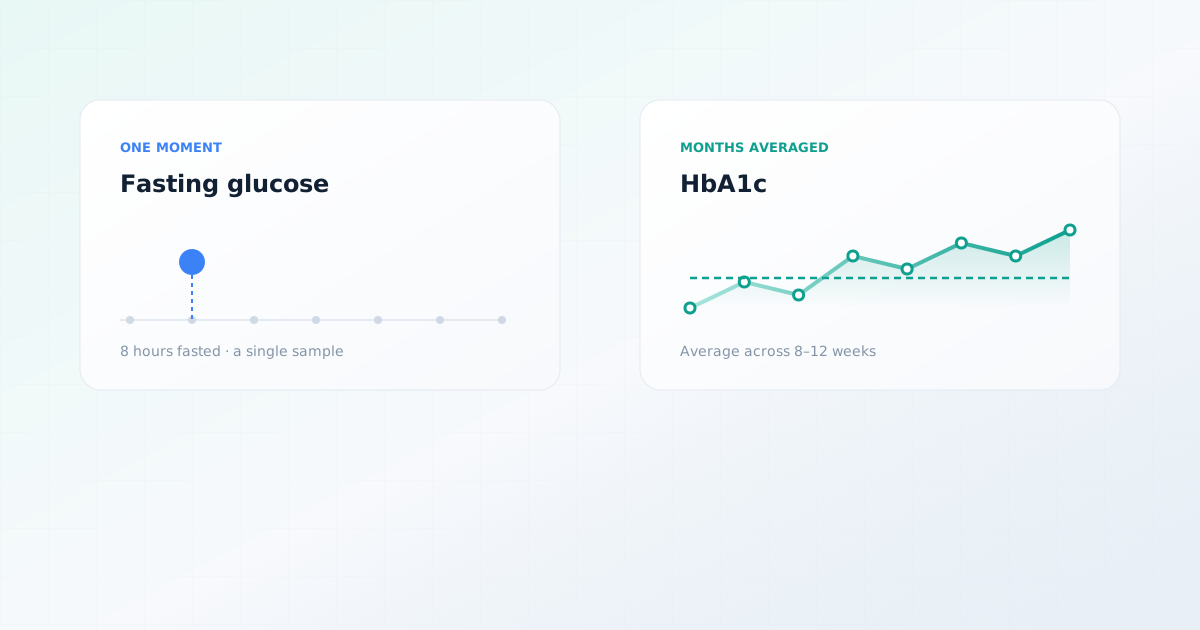
- The amount of sugar in your blood at the moment the sample was taken. Interpretation depends entirely on when it was taken — fasting, before a meal, after a meal, or at random.
- HbA1c
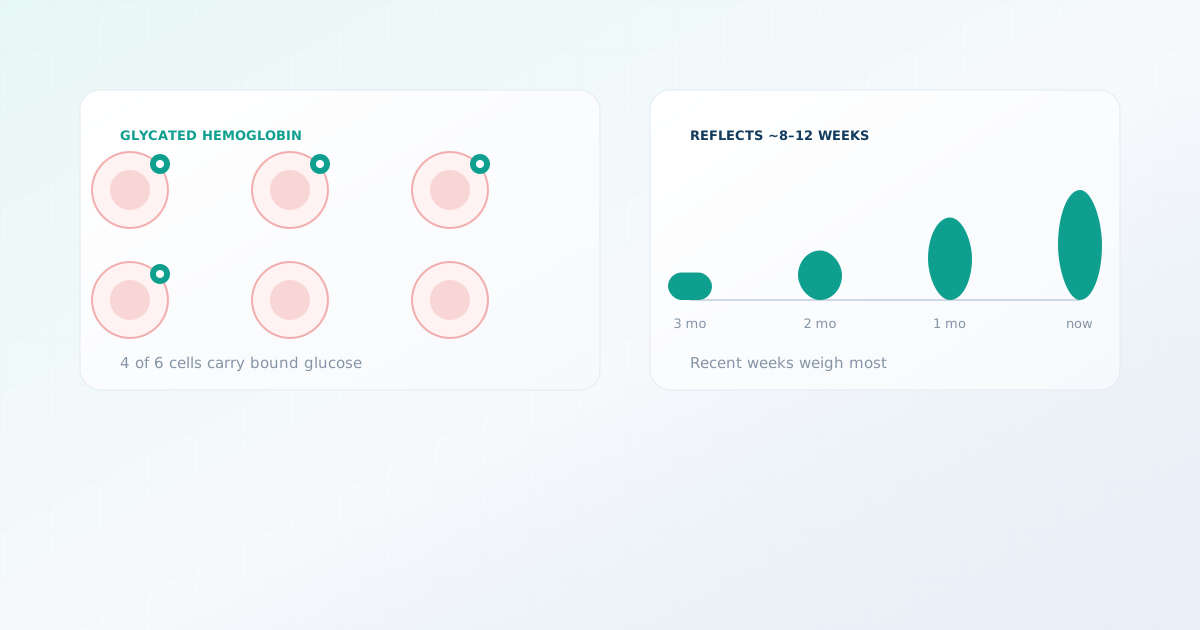
- The percentage of hemoglobin with glucose attached, reflecting average glucose over roughly the previous two to three months. Needs no fasting.
| Test | Reference range | Prediabetes range | Diabetes range |
|---|---|---|---|
| Fasting glucose | 70 – 99 mg/dL · 3.9 – 5.5 mmol/L | 100 – 125 mg/dL · 5.6 – 6.9 mmol/L | 126+ mg/dL · 7.0+ mmol/L |
| HbA1c | Below 5.7% · below 39 mmol/mol | 5.7 – 6.4% · 39 – 46 mmol/mol | 6.5%+ · 48+ mmol/mol |
The main pitfall here is that HbA1c can be shifted by anything affecting red blood cells — anemia, recent blood loss or transfusion, pregnancy, chronic kidney disease, or a hemoglobin variant — independently of your actual glucose.
Try the calculatorConvert HbA1c to estimated average glucoseThe lipid panel
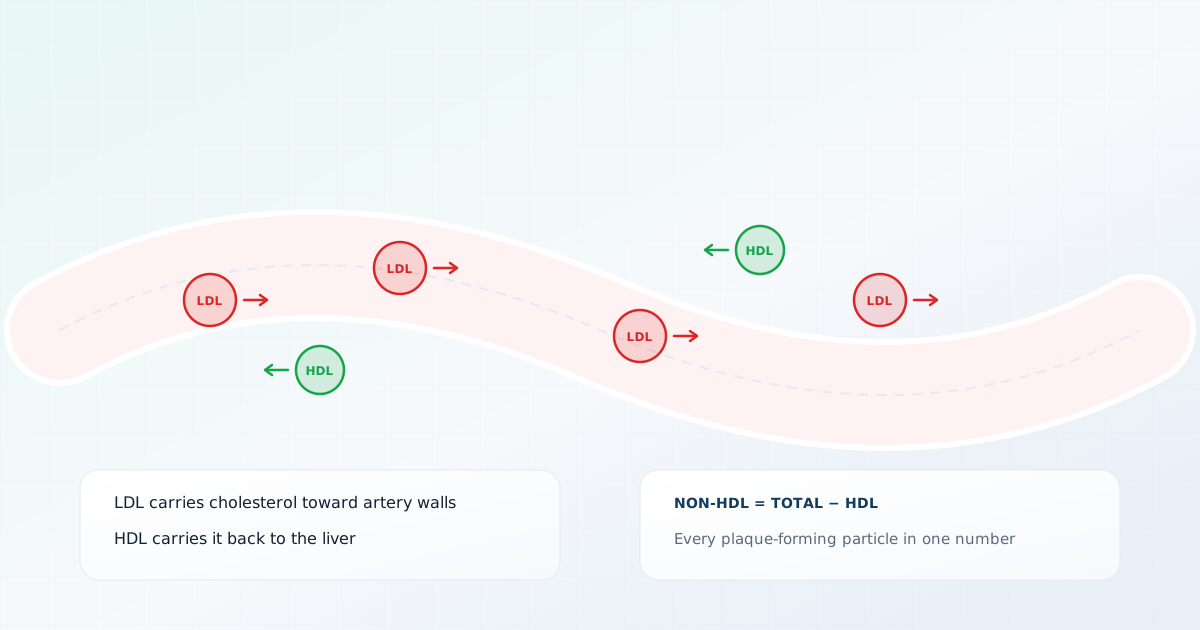
A lipid panel reports total cholesterol, HDL, LDL and triglycerides. Cholesterol travels inside lipoprotein particles, and the fractions are named for those particles — LDL carries cholesterol toward tissues including artery walls, HDL carries it back to the liver.
| Test | Desirable | Borderline | High |
|---|---|---|---|
| Total cholesterol | Below 200 mg/dL · 5.2 mmol/L | 200 – 239 mg/dL | 240+ mg/dL |
| LDL cholesterol | Below 100 mg/dL · 2.6 mmol/L | 130 – 159 mg/dL | 160+ mg/dL |
| HDL cholesterol | 60+ mg/dL · 1.5+ mmol/L | 40 – 59 mg/dL (men) | Below 40 mg/dL is less favorable |
| Triglycerides | Below 150 mg/dL · 1.7 mmol/L | 150 – 199 mg/dL | 200+ mg/dL |
| Non-HDL cholesterol | Below 130 mg/dL · 3.4 mmol/L | 130 – 159 mg/dL | 160+ mg/dL |
Two things to note. LDL is usually calculated rather than measured, and different equations give different answers from the same sample — so a change between reports may reflect a change of method. And total cholesterol is the least informative number on the panel, because it sums fractions that behave in opposite ways.
The 2026 ACC/AHA dyslipidemia guideline also added two tests that will not be on an older report. Lipoprotein(a) is now recommended at least once for every adult, and apolipoprotein B is used selectively where risk remains after the LDL-C and non-HDL-C goals have been met. Neither can be calculated from the four numbers above; both have to be requested.
Try the calculatorWork out non-HDL cholesterol from your panelCreatinine and eGFR
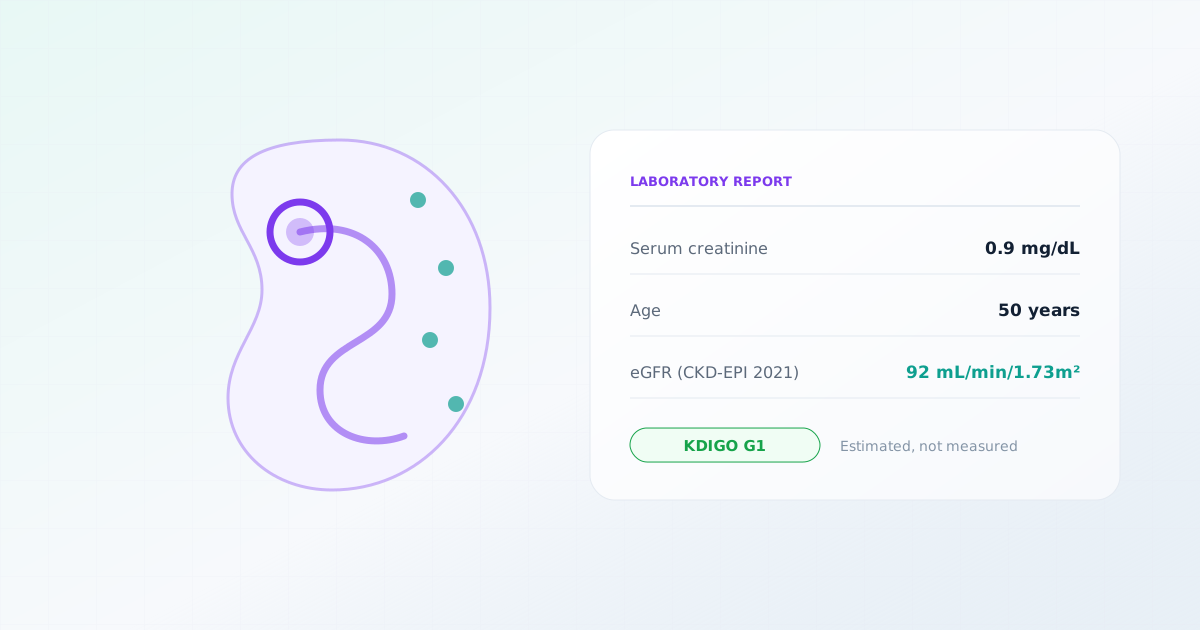
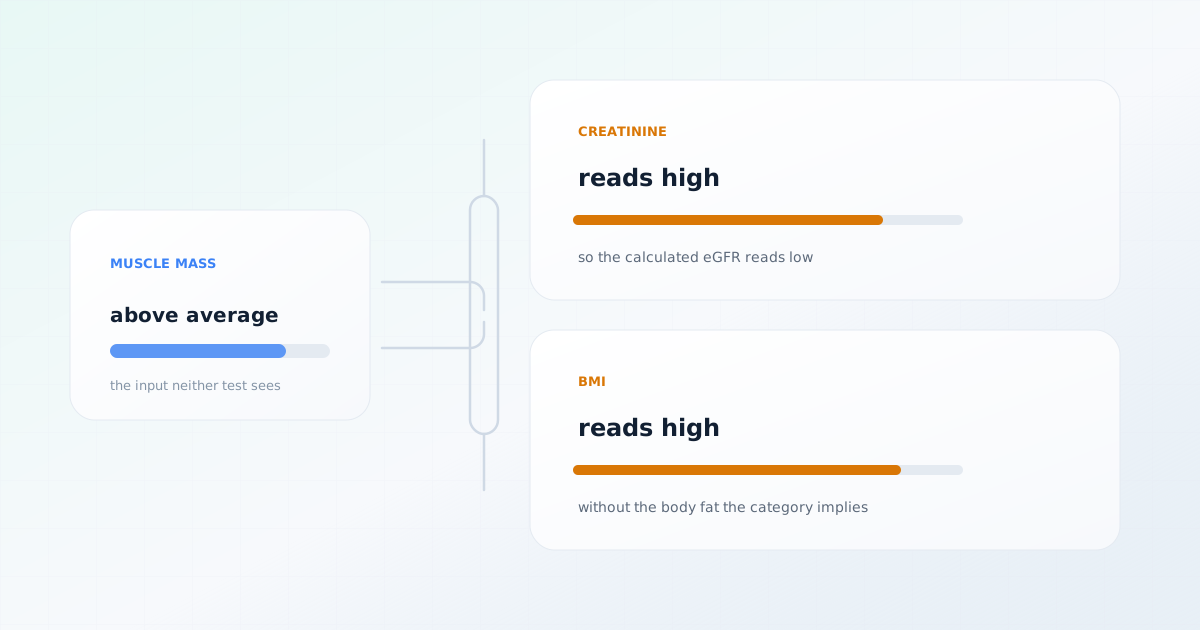
Creatinine is a waste product of muscle metabolism that healthy kidneys clear. eGFR converts a creatinine value, together with age and sex, into an estimate of how much blood the kidneys filter each minute.
| Test | Typical adult range | Notes |
|---|---|---|
| Creatinine (men) | 0.74 – 1.35 mg/dL · 65 – 119 µmol/L | Higher baseline reflects greater average muscle mass |
| Creatinine (women) | 0.59 – 1.04 mg/dL · 52 – 92 µmol/L | Laboratory ranges vary |
| eGFR | 90+ mL/min/1.73m² often reported as "greater than 90" | Least precise in the normal range |
Because creatinine comes from muscle, eGFR is shifted by muscle mass, a recent high-protein meal, creatine supplements, intense exercise, dehydration, and medications such as trimethoprim — none of which involve kidney function changing. Kidney assessment pairs eGFR with a urine albumin-to-creatinine ratio.
Try the calculatorCalculate eGFR from a creatinine resultLiver enzymes: ALT and AST
- ALT (alanine transaminase)
- An enzyme found mainly in liver cells. It is the more liver-specific of the two, so a raised ALT points more directly at the liver.
- AST (aspartate aminotransferase)
- An enzyme found in the liver but also in muscle, heart and red blood cells. A raised AST can therefore reflect muscle damage rather than a liver problem.
The ratio between them carries information the individual values do not. An AST substantially higher than ALT has different implications from the reverse pattern, and clinicians use that relationship as part of the interpretation.
A common false alarm
Vitamin D and vitamin B12
Vitamin D status is assessed by measuring 25-hydroxyvitamin D. Units differ — ng/mL in the United States, nmol/L elsewhere, converting at 1 ng/mL = 2.5 nmol/L — and the thresholds themselves are genuinely contested between expert bodies, with different groups drawing the line for sufficiency at different points. A value described as insufficient by one set of criteria may be described as adequate by another.
Vitamin B12 is measured as total serum B12, which has a known weakness: most circulating B12 is bound to a protein that does not deliver it to cells, so a total level can look adequate while functional deficiency exists. Where deficiency is suspected despite a normal-looking B12, methylmalonic acid or homocysteine are more sensitive functional markers.
Supplements affect results
How clinicians read a panel
The difference between reading a report and interpreting it is largely that a clinician looks for patterns and comparisons rather than checking values against ranges one at a time.
- How far outside the range is it? A value 2% outside is treated quite differently from one at twice the upper limit.
- What is the trend? A creatinine of 1.3 mg/dL that has been 1.3 for five years differs from one that was 0.9 last year.
- Do the results form a pattern? Raised triglycerides with low HDL and raised glucose is a recognisable metabolic pattern; each finding alone says less.
- What could have distorted it? Fasting status, recent exercise, illness, hydration, supplements and medications all matter.
- Does it match the person? A result that does not fit the clinical picture is often repeated before being acted on.
What this article cannot do
Frequently asked questions
Sources
This page is based on the following sources. Each was reviewed on the access date shown.
- Medical Tests(opens in a new tab)
MedlinePlus (US National Library of Medicine)
Government health agencyAccessed September 27, 2026
- Diagnosis and Classification of Diabetes: Standards of Care in Diabetes-2026(opens in a new tab)
Diabetes Care (American Diabetes Association)
Clinical guidelinePublished January 1, 2026Accessed October 1, 2026
- 2026 ACC/AHA/Multisociety Guideline on the Management of Dyslipidemia(opens in a new tab)
Journal of the American College of Cardiology
Clinical guidelinePublished March 13, 2026Accessed October 1, 2026DOI 10.1016/j.jacc.2025.11.016
- KDIGO 2024 Clinical Practice Guideline for the Evaluation and Management of Chronic Kidney Disease(opens in a new tab)
Kidney Disease: Improving Global Outcomes (KDIGO)
Clinical guidelinePublished March 1, 2024Accessed September 27, 2026
- ALT Blood Test(opens in a new tab)
MedlinePlus (US National Library of Medicine)
Government health agencyAccessed September 27, 2026
- Liver Function Tests(opens in a new tab)
MedlinePlus (US National Library of Medicine)
Government health agencyAccessed September 27, 2026
- Vitamin D — Health Professional Fact Sheet(opens in a new tab)
NIH Office of Dietary Supplements
Government health agencyAccessed September 27, 2026
- Vitamin B12 — Health Professional Fact Sheet(opens in a new tab)
NIH Office of Dietary Supplements
Government health agencyAccessed September 27, 2026
- Blood Cholesterol(opens in a new tab)
National Heart, Lung, and Blood Institute (NIH)
Government health agencyAccessed September 27, 2026
- Estimated Glomerular Filtration Rate (eGFR)(opens in a new tab)
National Kidney Foundation
Professional societyAccessed September 27, 2026