A1C vs Fasting Blood Sugar: What’s the Difference?
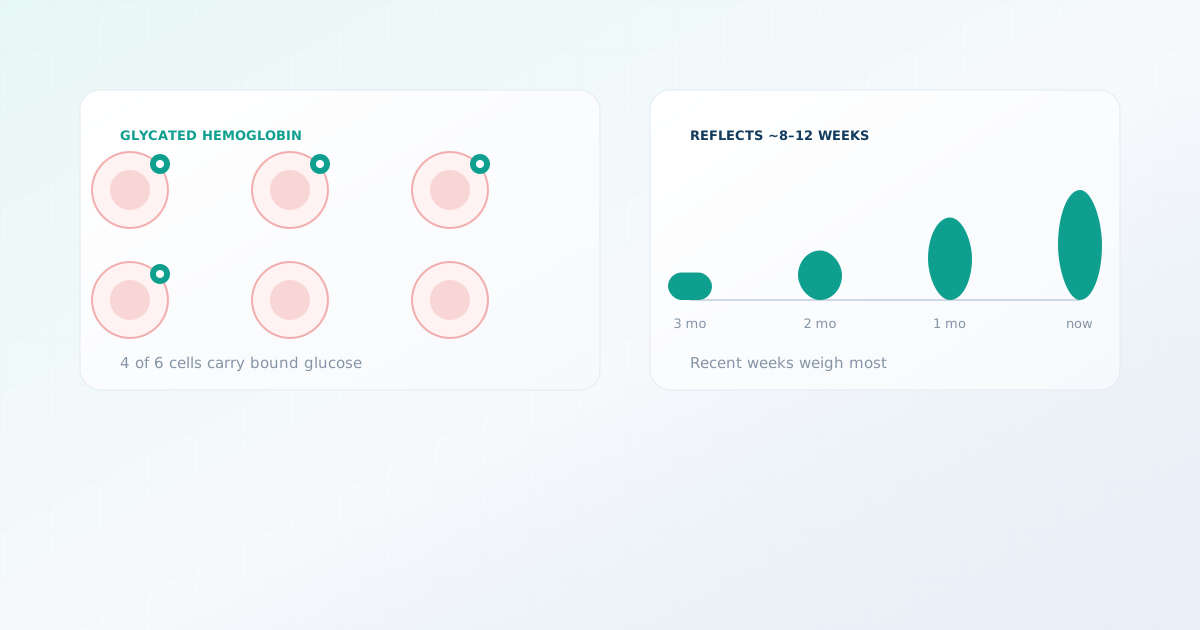
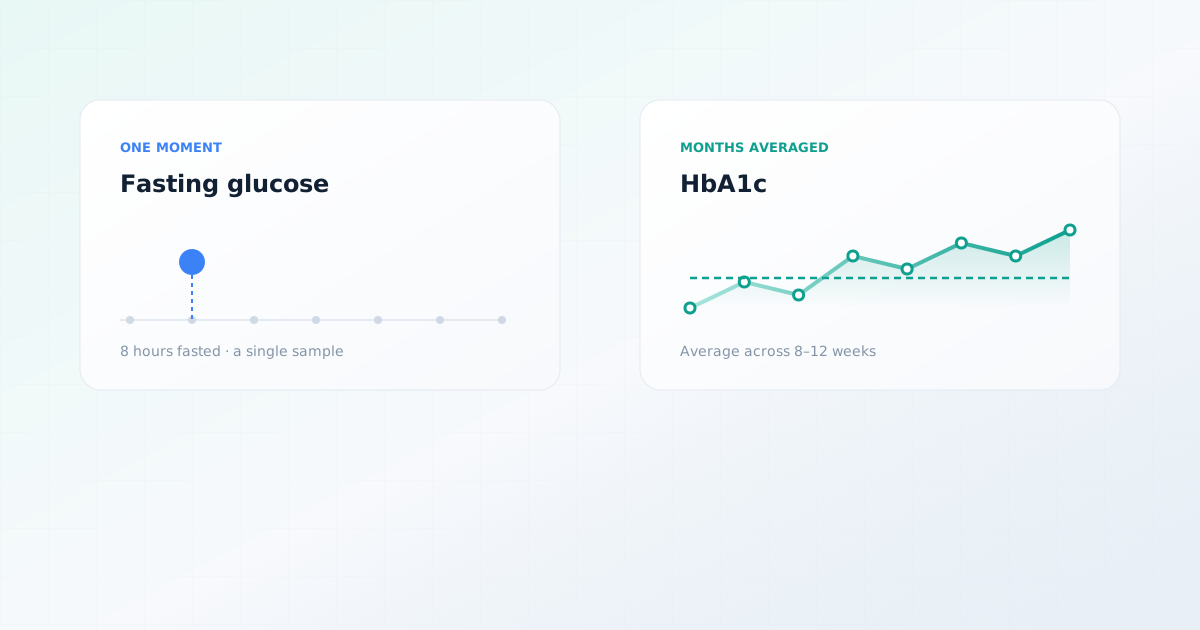
A fasting blood sugar test measures glucose at one moment after not eating; A1C reflects average glucose over two to three months. They answer different questions, they can disagree without either being wrong, and clinicians deliberately use both.
The short answer
A fasting blood sugar test takes a photograph. A1C paints a portrait over months. Both are pictures of the same subject — how your body handles glucose — but one captures an instant under controlled conditions, and the other captures an accumulated average.
| Property | Fasting blood glucose | A1C |
|---|---|---|
| What it measures | Glucose concentration in blood right now | Percentage of hemoglobin with glucose attached |
| Time period covered | One moment | Roughly 8–12 weeks |
| Preparation | 8 or more hours without food or drink except water | None |
| Affected by last night’s meal | Yes, substantially | No |
| Affected by red blood cell conditions | No | Yes, significantly |
| Shows daily highs and lows | Only at the moment measured | No |
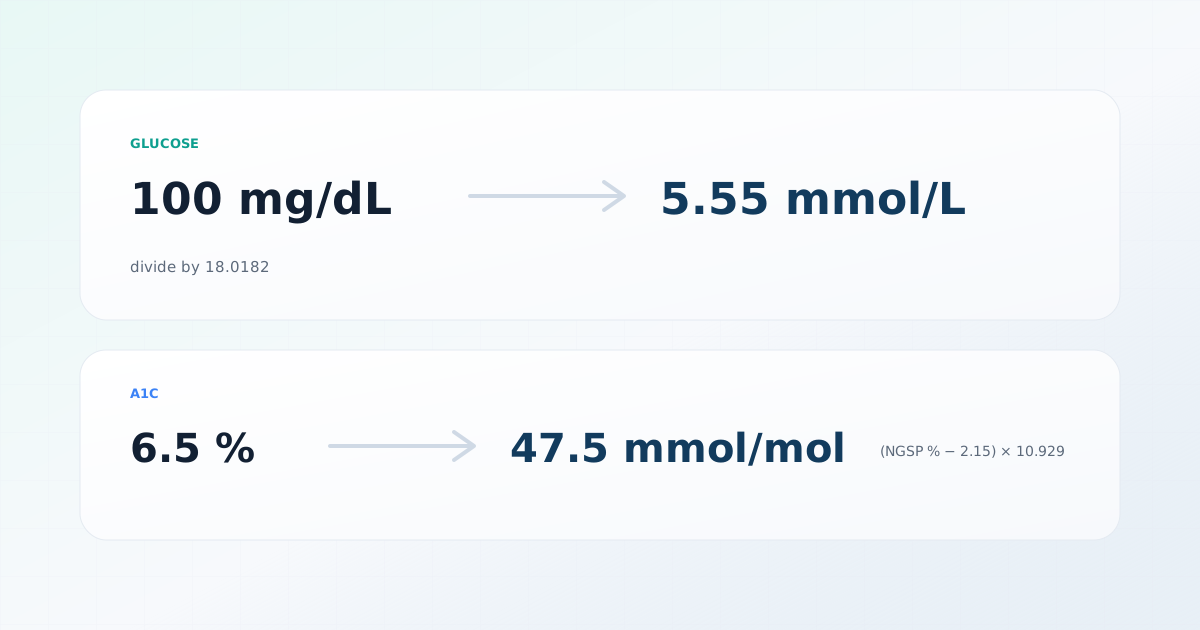
| Screening threshold | 126 mg/dL · 7.0 mmol/L | 6.5% · 48 mmol/mol |
What a fasting glucose test shows
Fasting means at least eight hours without food or drink other than water — in practice, a blood sample taken first thing in the morning. The point of the fast is standardization: it removes the effect of whatever you last ate, so the result reflects your body’s baseline glucose control rather than your breakfast.
What that baseline reflects is mostly the liver. Overnight, with no glucose arriving from food, your liver releases stored glucose to keep your brain supplied, and insulin regulates how much. A raised fasting glucose often indicates that this regulation is working less efficiently — that the liver is releasing more glucose than insulin is managing to restrain.
| Range | mg/dL | mmol/L |
|---|---|---|
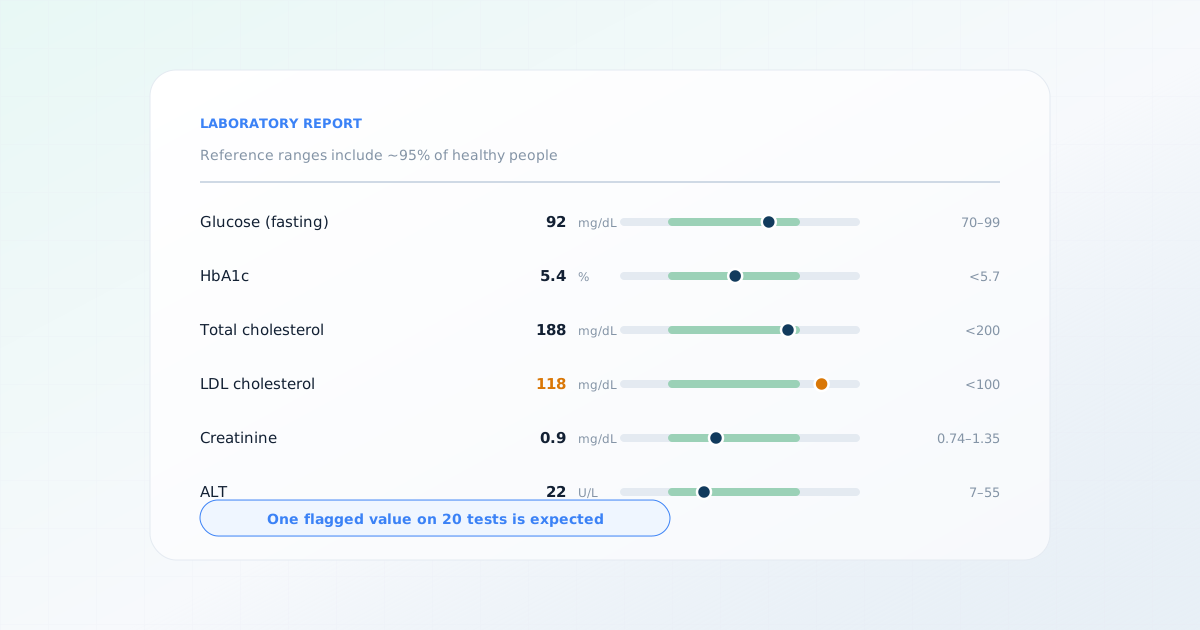
| Within the reference range | 70 – 99 | 3.9 – 5.5 |
| Prediabetes screening range (impaired fasting glucose) | 100 – 125 | 5.6 – 6.9 |
| Diabetes screening range | 126 and above | 7.0 and above |
The third measurement: after eating
Fasting glucose and A1C are the two tests people usually compare, but there is a third that often matters more than either: glucose after a meal, sometimes called postprandial glucose.
In many people, the earliest detectable change in glucose handling is not a raised fasting level but an exaggerated rise after eating, which then returns to normal. A fasting test taken at 8am will miss this entirely. A1C will register it only faintly, diluted into a months-long average. The formal way to detect it is an oral glucose tolerance test, where glucose is measured two hours after a standardized sugary drink.
| Range | mg/dL | mmol/L |
|---|---|---|
| Within the reference range | Below 140 | Below 7.8 |
| Prediabetes screening range (impaired glucose tolerance) | 140 – 199 | 7.8 – 11.0 |
| Diabetes screening range | 200 and above | 11.1 and above |
Why this matters for interpreting a normal result
Why the two tests can disagree
It is common for a fasting glucose and an A1C to point in slightly different directions. This usually reflects something real rather than a laboratory error.
Consider the case of a normal fasting glucose with a raised A1C. The fast measured one moment, at the time of day when glucose is typically lowest. If glucose rises substantially after meals and stays up for hours, the A1C accumulates that exposure while the fasting sample never sees it. The tests are not contradicting each other; they are describing different parts of the same day.
The reverse — a raised fasting glucose with a normal A1C — can occur when the fasting result was unrepresentative. A poor night’s sleep, acute stress, illness, a very late meal, or the dawn phenomenon of early-morning hormonal glucose release can all raise one morning’s reading. It can also occur when something is lowering A1C independently of glucose.
- Conditions that shorten red blood cell lifespan lower A1C: hemolytic anemia, recent blood loss, recent transfusion, erythropoietin treatment.
- Iron deficiency anemia raises A1C by extending red cell survival.
- Chronic kidney disease can move A1C in either direction.
- Hemoglobin variants interfere with some A1C assay methods.
- Individual variation in glycation rate means some people consistently run a higher or lower A1C than their glucose predicts.
A disagreement is a finding, not a failure
How clinicians use several measurements together
Because each test has a different blind spot, they are used in combination rather than ranked against each other. A typical assessment builds up a picture rather than looking for one number to settle the question.
- A1C establishes the long-term average and needs no fasting, which makes it convenient as a first test.
- Fasting glucose checks baseline regulation and is the appropriate test when A1C may be unreliable.
- An oral glucose tolerance test reveals impaired glucose tolerance that the other two can miss.
- Where available, continuous glucose monitoring shows variability, time in range and the shape of post-meal rises — the information an average conceals.
- The trend across previous results is weighed alongside the current ones, because direction of travel often matters more than a single value.
Guidelines are also explicit that a single abnormal screening result is generally not enough. Confirmation usually means either repeating the same test or performing a different one, because laboratory results have measurement variability and one-off factors can distort any single sample.
The limits of any single measurement
Every glucose measurement has a margin of error, and understanding its size prevents over-reading small differences.
- Laboratory glucose assays have their own analytical variation, and biological variation in fasting glucose between mornings in the same person is larger still — commonly several mg/dL.
- Home glucose meters are permitted a margin of error against laboratory plasma glucose under regulatory standards, so a meter and a lab result from the same moment can legitimately differ.
- Continuous glucose monitors measure interstitial fluid rather than blood, and lag behind when glucose is changing quickly.
- A1C assays are standardized but not identical between laboratories, and comparing results from different laboratories is less reliable than tracking one.
- A difference of 0.1% or 0.2% in A1C, or a few mg/dL in fasting glucose, is usually within measurement noise rather than a meaningful change.
Screening thresholds are not diagnostic verdicts
Frequently asked questions
Sources
This page is based on the following sources. Each was reviewed on the access date shown.
- Diagnosis and Classification of Diabetes: Standards of Care in Diabetes-2026(opens in a new tab)
Diabetes Care (American Diabetes Association)
Clinical guidelinePublished January 1, 2026Accessed October 1, 2026
- Diabetes in the United States: A U.S. Report Card(opens in a new tab)
Centers for Disease Control and Prevention
Government health agencyAccessed October 1, 2026
- The A1C Test and Diabetes(opens in a new tab)
National Institute of Diabetes and Digestive and Kidney Diseases (NIH)
Government health agencyAccessed September 27, 2026
- Testing for Diabetes and Prediabetes(opens in a new tab)
Centers for Disease Control and Prevention
Government health agencyAccessed September 27, 2026
- Translating the A1C assay into estimated average glucose values(opens in a new tab)
Diabetes Care (American Diabetes Association)
Peer-reviewed articlePublished August 1, 2008Accessed September 27, 2026DOI 10.2337/dc08-0545
- Understanding A1C(opens in a new tab)
American Diabetes Association
Professional societyAccessed September 27, 2026