BMR vs TDEE: Understanding Daily Calorie Needs
BMR is the energy your body uses at complete rest; TDEE adds everything else you do. Both are predicted from equations rather than measured, and the predictions carry a margin of roughly 10% before activity estimates widen it further.
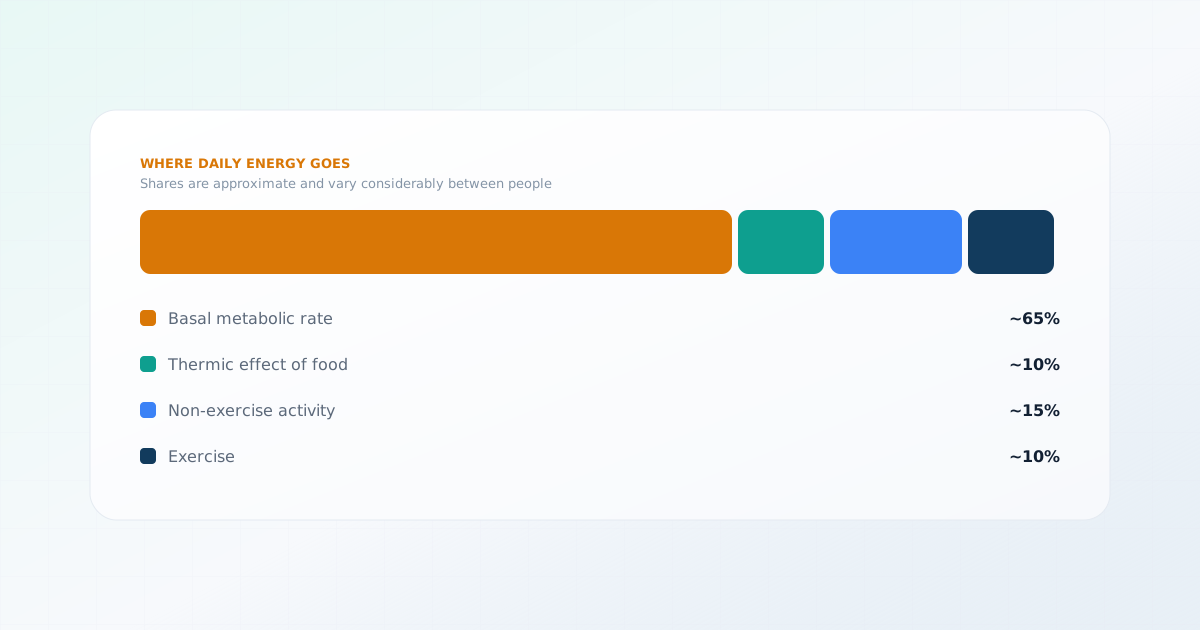
Where daily energy actually goes
Total daily energy expenditure is conventionally broken into four components. Knowing their relative sizes makes it much clearer why estimating the total is difficult.
| Component | Share of total | What it covers |
|---|---|---|
| Basal metabolic rate | About 60 – 70% | Organ function, cell maintenance, breathing, circulation, temperature |
| Thermic effect of food | About 8 – 12% | Energy used digesting, absorbing and storing what you eat |
| Non-exercise activity (NEAT) | About 5 – 20% | Standing, walking about, fidgeting, everything that is not deliberate exercise |
| Exercise activity | 0 – 30%+ | Deliberate training; near zero for many people, dominant for athletes |
The striking part of that table is the third row. Non-exercise activity thermogenesis varies by hundreds of calories a day between people of similar size, driven by how much they move without thinking about it. It is largely unconscious, difficult to measure, and impossible to predict from height, weight, age and sex — which is the fundamental reason TDEE estimates are imprecise.
BMR: the resting baseline
- Basal metabolic rate
- The energy your body uses to sustain basic function at complete rest — measured, strictly, after an overnight fast, lying still, awake, in a thermally neutral environment.
Most of that energy goes to organs rather than to muscle at rest. The brain alone accounts for roughly 20% of resting energy use, with the liver, heart and kidneys taking large shares relative to their mass. This is why BMR correlates with body size in general rather than with muscle specifically.
You can measure BMR directly, by indirect calorimetry — measuring oxygen consumption and carbon dioxide production under controlled conditions. It is accurate and requires a laboratory, so in practice it is predicted from an equation.
Men: BMR = (10 × weight in kg) + (6.25 × height in cm) − (5 × age) + 5 · Women: the same, minus 161
Mifflin-St Jeor is the equation most commonly recommended for adults in current dietetic practice, after a systematic review compared the available predictive equations against measured resting metabolic rate and found it the most reliable. It replaced the older Harris-Benedict equations, which were derived from a study population less representative of modern adults and tend to overestimate.
Try the calculatorEstimate your BMR and TDEETDEE: adding everything else
Total daily energy expenditure is BMR multiplied by an activity factor. The multipliers below are the conventional brackets used in dietetic practice.
| Activity level | Factor | Description |
|---|---|---|
| Sedentary | 1.2 | Desk-based work, little deliberate exercise |
| Lightly active | 1.375 | Light exercise or sport 1 – 3 days a week |
| Moderately active | 1.55 | Moderate exercise or sport 3 – 5 days a week |
| Very active | 1.725 | Hard exercise or sport 6 – 7 days a week |
| Extremely active | 1.9 | Physically demanding job, or hard training twice a day |
Look at the size of the steps. Moving from sedentary to moderately active multiplies the estimate by 1.29 — on a BMR of 1,600 kcal, that is a difference of over 450 kcal a day, decided by a single dropdown choice. The brackets are wide, and most people overestimate which one they belong in.
Two people, one bracket, different totals
How accurate is any of this?
It is worth being concrete about the error, because the output of a calculator looks far more precise than it is.
- Mifflin-St Jeor predicts measured resting metabolic rate within about 10% for most people. At a BMR of 1,800 kcal, that is a spread of roughly 180 kcal before anything else is added.
- A meaningful minority of individuals fall outside that 10% band in either direction.
- The activity multiplier adds its own uncertainty, and it multiplies the BMR error rather than adding to it.
- The equation has no input for body composition. At identical height, weight, age and sex, more muscle generally means a higher BMR than predicted.
The reasonable conclusion is not that the estimate is useless — it is a much better starting point than guessing. It is that the number should be treated as a hypothesis to check against what actually happens, rather than a fact about your body.
What the equation cannot account for
Several real influences on energy expenditure are simply absent from the model.
- Body composition. Muscle is more metabolically active at rest than fat, so composition shifts BMR at the same weight.
- Thyroid function. An overactive thyroid raises resting metabolism substantially; an underactive one lowers it.
- Metabolic adaptation. Sustained energy restriction lowers resting expenditure by more than the weight loss alone predicts, and non-exercise movement tends to fall too.
- Medications. Some, including certain antipsychotics, antidepressants and corticosteroids, affect weight and metabolism.
- Pregnancy and breastfeeding, both of which raise requirements considerably.
- Illness, injury and recovery, which can raise resting expenditure well above baseline.
- Genetics. Resting metabolic rate varies between individuals at the same body composition for reasons not captured by any of the inputs.
Why food labels add their own uncertainty
Using the numbers sensibly
- Take the estimate as a starting point, not a target. It tells you roughly where you are, not exactly what you need.
- Choose the lower activity bracket if you are unsure. Overestimating activity is the single most common source of error.
- Observe over two to four weeks rather than reacting to daily fluctuation, most of which is water and food in transit rather than tissue.
- Adjust based on what actually happens. Your own response is better evidence than any equation.
- Remember that both sides of the comparison — expenditure and intake — carry error, so small discrepancies are not informative.
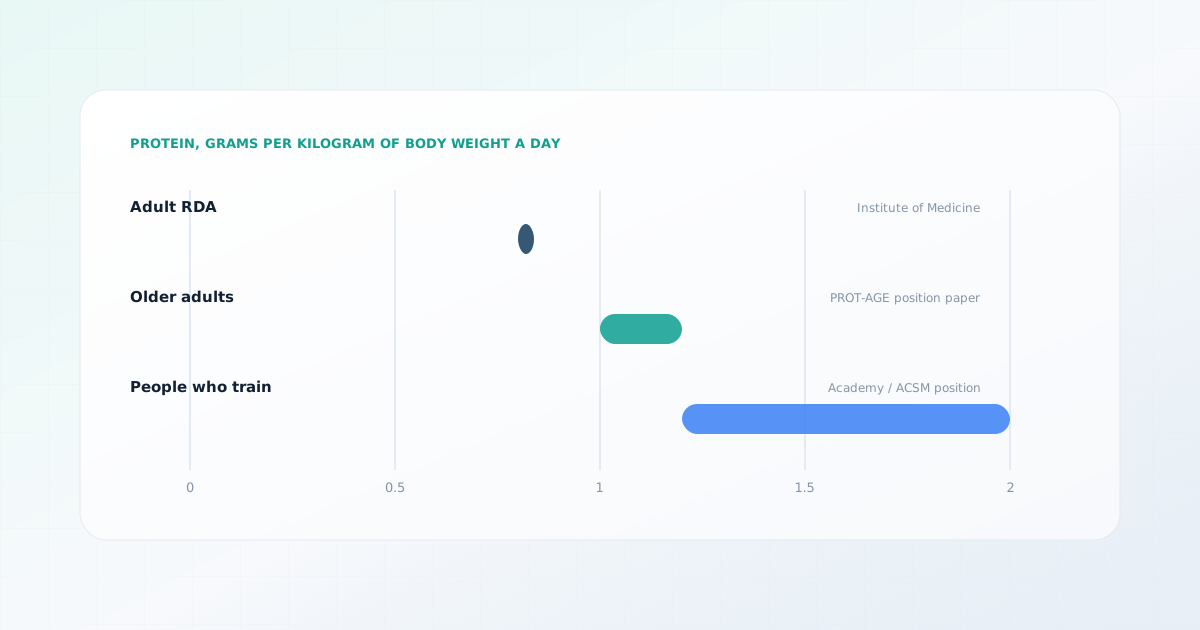
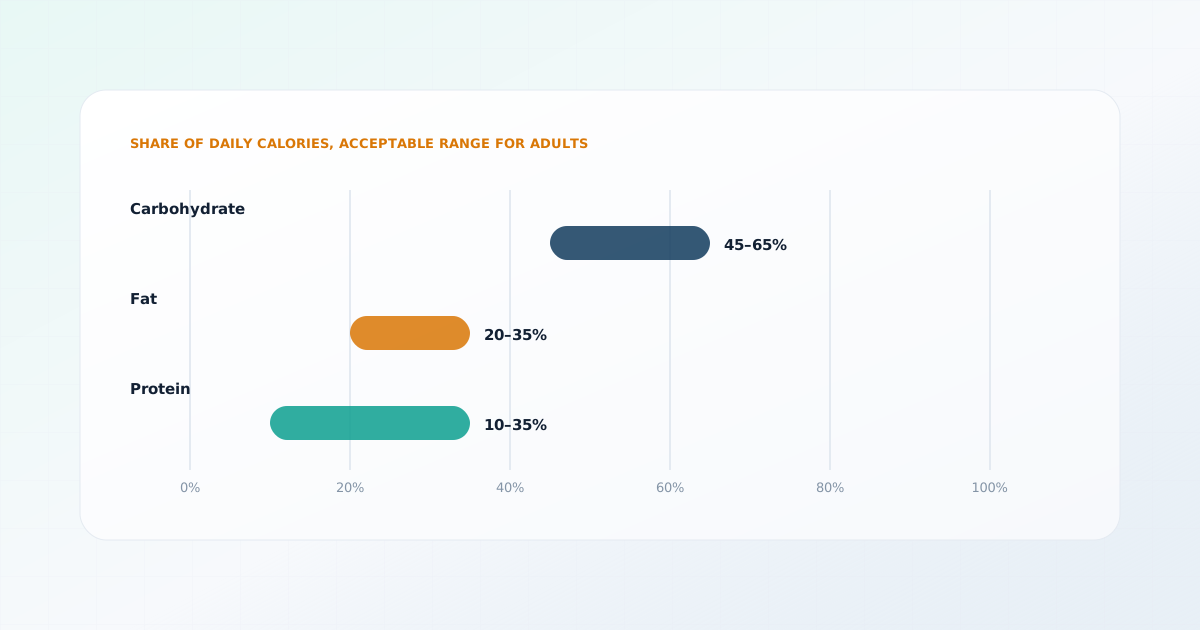
A calorie figure on its own also leaves the next question open: what that energy is made of. The 2025-2030 Dietary Guidelines for Americans, released in January 2026, set the federal reference point for how protein, carbohydrate and fat divide up a day’s intake, and the acceptable ranges are wide enough that several very different patterns sit inside them. Protein is the component with the clearest evidence behind a specific target, and the one most often set too low when energy intake comes down.
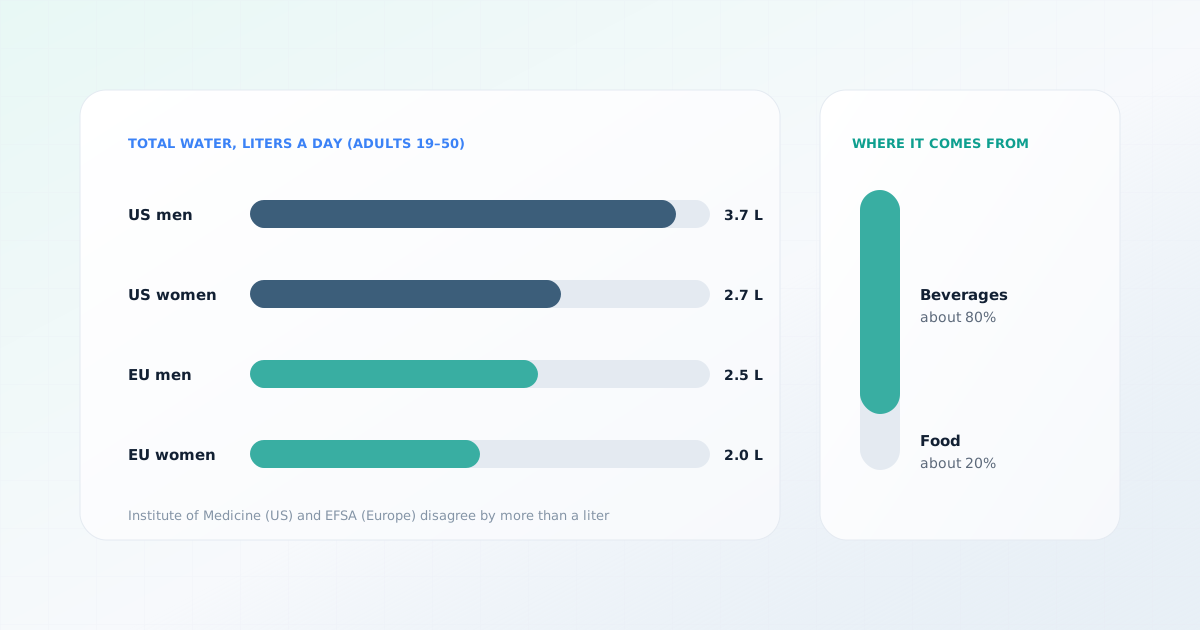
Try the calculatorSplit a calorie target into protein, carbohydrate and fatTry the calculatorWork out a daily protein target from body weightFluid is the other number people look for alongside energy, and it is the one with the weakest case for a formula. Requirements vary with body size, activity, climate and what you eat, and a large share of daily intake arrives in food rather than drinks — which is why "eight glasses" has never had a source behind it.
Try the calculatorSee where daily fluid estimates come from, and their limitsWhen these numbers are the wrong tool
Frequently asked questions
Sources
This page is based on the following sources. Each was reviewed on the access date shown.
- A new predictive equation for resting energy expenditure in healthy individuals(opens in a new tab)
The American Journal of Clinical Nutrition
Peer-reviewed articlePublished February 1, 1990Accessed September 27, 2026DOI 10.1093/ajcn/51.2.241
- Comparison of predictive equations for resting metabolic rate in healthy nonobese and obese adults: a systematic review(opens in a new tab)
Journal of the American Dietetic Association
Systematic reviewPublished May 1, 2005Accessed September 27, 2026
- Dietary Guidelines for Americans, 2025-2030(opens in a new tab)
US Department of Agriculture and US Department of Health and Human Services
Clinical guidelinePublished January 7, 2026Accessed October 1, 2026
- A healthy lifestyle — WHO recommendations(opens in a new tab)
World Health Organization
Government health agencyAccessed September 27, 2026
- About Adult BMI(opens in a new tab)
Centers for Disease Control and Prevention
Government health agencyAccessed September 27, 2026