Carbs, Protein and Fat: What the Official Macronutrient Ranges Mean
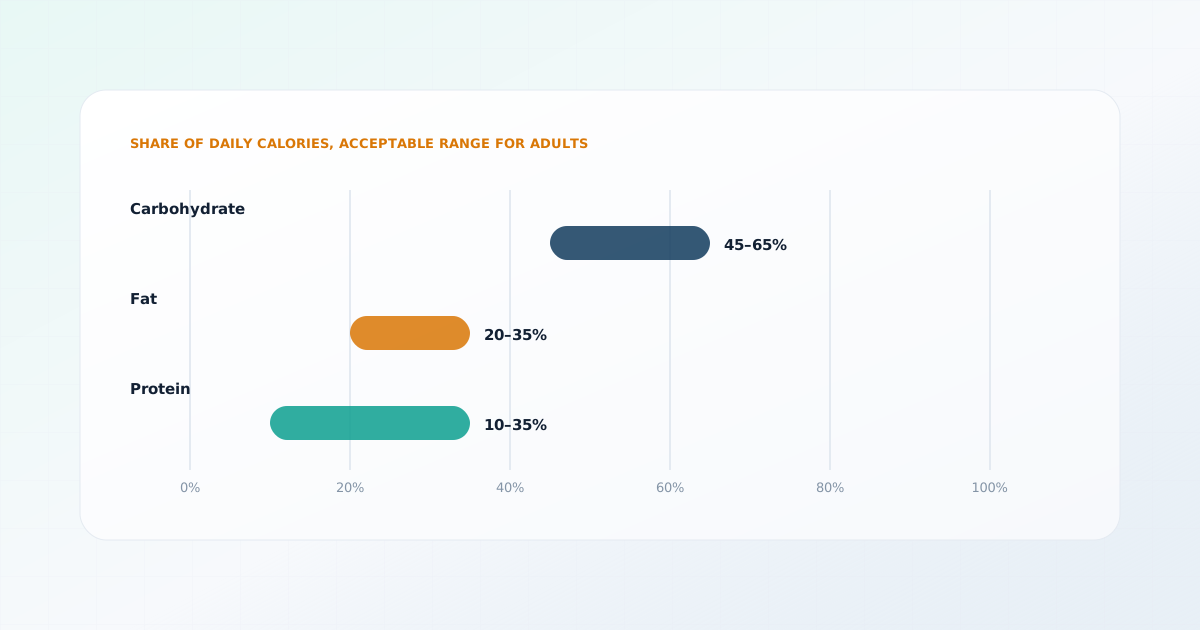
US reference ranges allow carbohydrate to supply 45 to 65 percent of calories, fat 20 to 35 percent and protein 10 to 35 percent. The ranges are deliberately wide, and a split inside them is a preference, not a prescription.
What macronutrients are and how percentages become grams
Macronutrients are the three nutrient groups that supply calories in food: carbohydrate, protein and fat. The conventional accounting gives carbohydrate and protein about 4 calories per gram and fat about 9 calories per gram. Those figures are averages that ignore small differences between foods, and they are the basis for converting a percentage of calories into grams on a food label.
The conversion is straightforward. Take someone eating 2,000 calories a day with 50 percent of calories from carbohydrate. That is 1,000 calories, and at 4 calories per gram, 250 grams of carbohydrate. The same person at 30 percent fat has 600 calories from fat, which at 9 calories per gram is about 67 grams.
| Macronutrient | Share of calories | Calories | Grams |
|---|---|---|---|
| Carbohydrate | 50 percent | 1,000 | 250 g |
| Protein | 20 percent | 400 | 100 g |
| Fat | 30 percent | 600 | 67 g |
The Acceptable Macronutrient Distribution Ranges
The Institute of Medicine published the Acceptable Macronutrient Distribution Ranges (AMDRs) in its 2005 Dietary Reference Intakes for energy, carbohydrate, fiber, fat, protein and amino acids. An AMDR is defined as the range of intake for a macronutrient that is associated with a reduced risk of chronic disease while providing adequate intakes of essential nutrients.
| Macronutrient | Share of daily calories |
|---|---|
| Carbohydrate | 45 to 65 percent |
| Fat | 20 to 35 percent |
| Protein | 10 to 35 percent |
Three details matter when reading these. The ranges are wide because the evidence does not point to a single optimal split; very different eating patterns fall inside them. They also overlap in a way that means not every combination of numbers works: the shares must sum to 100 percent, so the top of one range cannot be combined with the tops of the others.
And each range has a floor for a reason. The lower end of the carbohydrate range sits well above the minimum amount the brain needs to function, and the fat range reflects a need for essential fatty acids and for carrying fat-soluble vitamins. Outside the range is not automatically unsafe, but the evidence for long-term health in those diets is less complete.
The type of carbohydrate, fat and protein matters as much as the ratio
Two diets with the same percentages can differ greatly in quality. Forty-five percent of calories from whole grains, beans, vegetables and fruit is a different thing from 45 percent from soft drinks and refined snacks, and the Dietary Guidelines for Americans, 2025 to 2030, organize their advice around foods and eating patterns rather than a single macro ratio.
- Carbohydrate: the World Health Organization strongly recommends that free sugars supply less than 10 percent of total energy intake, and the Institute of Medicine fiber adequate intake of 14 grams per 1,000 calories highlights that most Americans fall short of fiber.
- Fat: the type matters as much as the amount, and major guidelines favor unsaturated fats such as those in nuts, seeds, fish and plant oils over saturated fat.
- Protein: sources vary in what comes with them, such as the fiber in legumes versus the saturated fat in some processed meats.
A percentage says nothing about food quality
Three splits that all sit inside the ranges
Because the ranges are wide, quite different eating patterns satisfy them at once. The table below converts three example splits to grams for a 2,000 calorie day, using 4 calories per gram for carbohydrate and protein and 9 for fat. All three fall inside every range, and the point is the arithmetic, not a choice among them.
| Split (carbohydrate / protein / fat) | Carbohydrate | Protein | Fat |
|---|---|---|---|
| 45 / 25 / 30 | 225 g | 125 g | 67 g |
| 55 / 20 / 25 | 275 g | 100 g | 56 g |
| 60 / 15 / 25 | 300 g | 75 g | 56 g |
The spread in protein, from 75 to 125 grams, is larger than most people expect from a range that appears to be only a few percentage points wide. That is a useful reminder that a percentage and a gram figure can feel quite different, and that for protein in particular the per-kilogram approach in our protein guide is often more meaningful than a share of calories.
Connecting the ranges to a food label
A US Nutrition Facts label lists grams of total carbohydrate, dietary fiber, total and added sugars, protein and total fat per serving, along with calories. Turning those into a share of calories uses the same 4-4-9 arithmetic: multiply grams of each macronutrient by its calories per gram and divide by the total.
- Check the serving size first, since every number on the label refers to it and many packages contain more than one serving.
- Dietary fiber and added sugars are both included within total carbohydrate, so they are not additional to it.
- Fiber has an adequate intake of 14 grams per 1,000 calories, which works out to about 28 grams on a 2,000 calorie day, and most people can compare that figure with the fiber line on their usual foods.
- Free sugars below 10 percent of calories is about 50 grams on a 2,000 calorie day, and added sugars on the label are the closest everyday measure of that.
Labels round and estimate
Where individuals sensibly differ from the middle
The width of the ranges is useful because it lets people choose a split that suits their circumstances. Endurance athletes often sit toward the higher end of carbohydrate because of training demands. Older adults and people who lift weights often aim toward more protein, with the individual ranges discussed in our protein guide. People managing diabetes may work with a dietitian on carbohydrate quantity and timing, a conversation where a general range is only a starting point.
Popular diets that fall outside the ranges, such as very low-carbohydrate or very low-fat patterns, exist and some people follow them under supervision. They are better described as therapeutic or experimental eating patterns than as the general reference, and anyone with a medical condition or taking glucose-lowering or blood pressure medicines should involve their clinician before making a major change, because medication needs can shift quickly.
Try the calculatorConvert a calorie target and a split into gramsUsing the ranges in practice
For most healthy adults, counting macros is optional. A diet built around vegetables, fruit, whole grains, legumes, fish, lean protein sources, dairy or alternatives and unsaturated fats will usually land inside every range without any arithmetic.
Where the numbers help is in diagnosis of an imbalance, for example noticing that a typical day is 70 percent refined carbohydrate and very little protein or fiber, or in planning for a specific athletic goal. In those cases a calculator turns a calorie estimate and a chosen split into grams that can be compared with food labels.
Estimates carry error
Frequently asked questions
Sources
This page is based on the following sources. Each was reviewed on the access date shown.
- Dietary Reference Intakes for Energy, Carbohydrate, Fiber, Fat, Fatty Acids, Cholesterol, Protein, and Amino Acids(opens in a new tab)
Institute of Medicine, Food and Nutrition Board
Reference workPublished January 1, 2005Accessed September 27, 2026
- Dietary Guidelines for Americans, 2025-2030(opens in a new tab)
US Department of Agriculture and US Department of Health and Human Services
Clinical guidelinePublished January 7, 2026Accessed October 1, 2026
- Guideline: Sugars intake for adults and children(opens in a new tab)
World Health Organization
Clinical guidelinePublished March 4, 2015Accessed September 27, 2026