Cholesterol Units Explained: mg/dL vs mmol/L and Why Triglycerides Differ
US labs report cholesterol in mg/dL and most other countries use mmol/L. Cholesterol and triglycerides have different conversion factors, 38.67 and 88.57, and using the wrong one overstates triglycerides about 2.3 times.
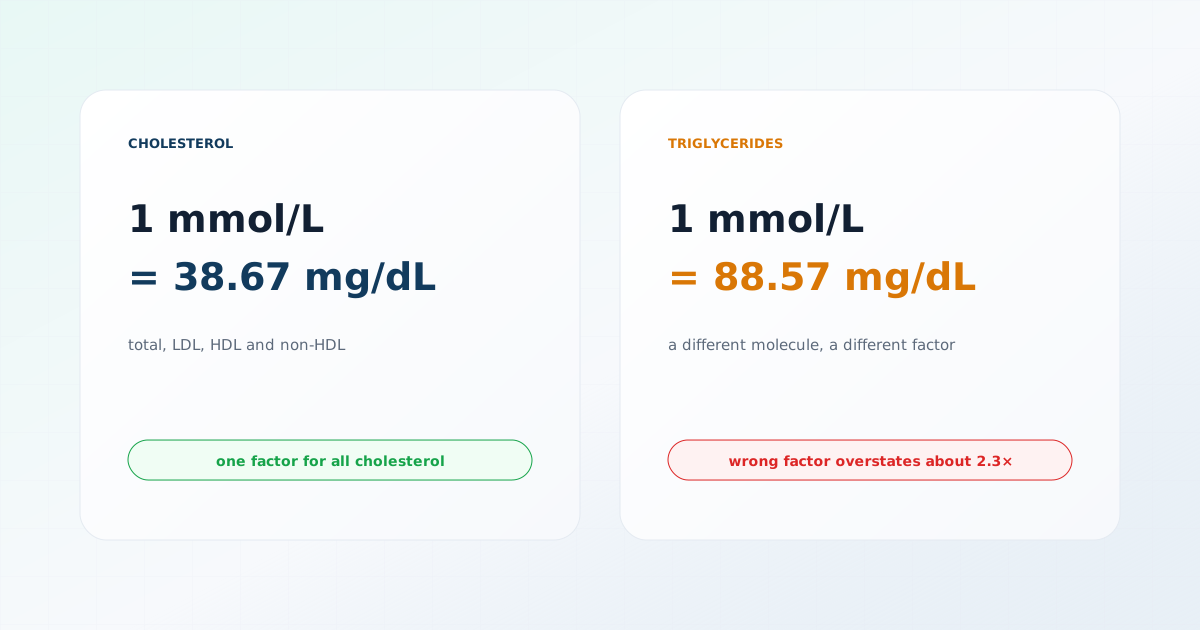
Two ways of writing the same lipid result
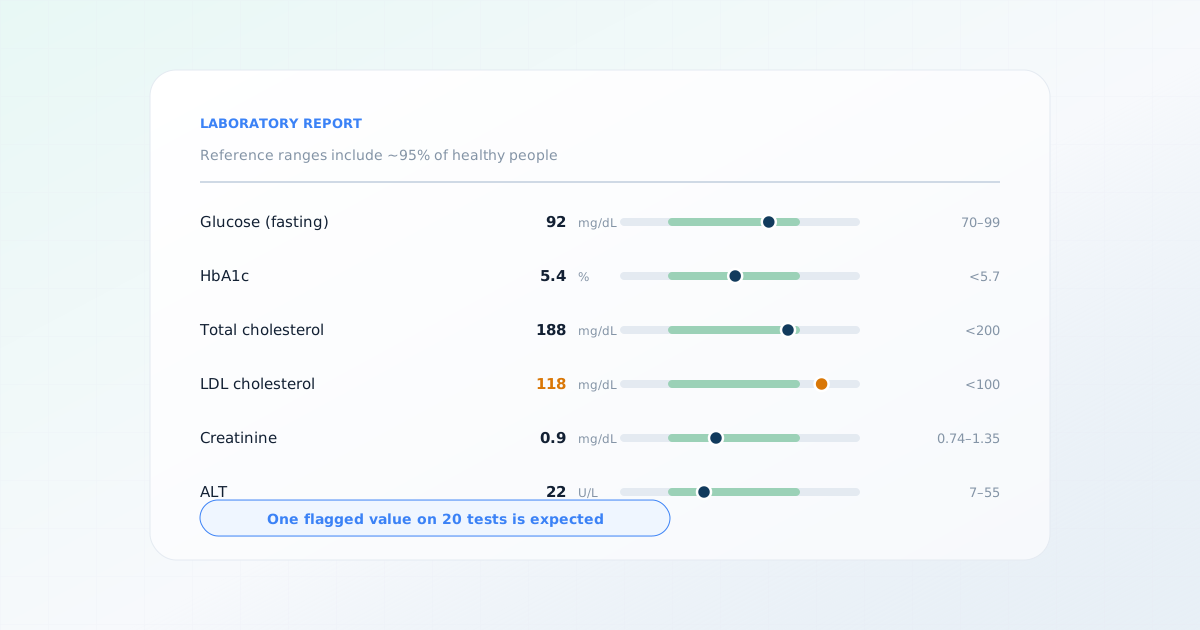
A lipid panel from a US laboratory lists values such as total cholesterol 190, LDL 100, HDL 55 and triglycerides 150, all in mg/dL. A report from a clinic in the UK, Europe or Australia shows the same measurements as 4.9, 2.6, 1.4 and 1.7, in mmol/L. Anyone who reads international guidance, uses a calculator from another country or moves between health systems will meet both, and without the conversion the numbers look unrelated.
The reason is the same one that applies to glucose. mg/dL is a mass concentration, milligrams of a substance in a tenth of a liter of blood. mmol/L is a molar concentration, millimoles of molecules in a liter. To convert between them you need the molar mass of the substance, and the molar mass of cholesterol is different from the molar mass of a triglyceride. That is why lipids need more care than glucose does.
Two substances, two conversion factors
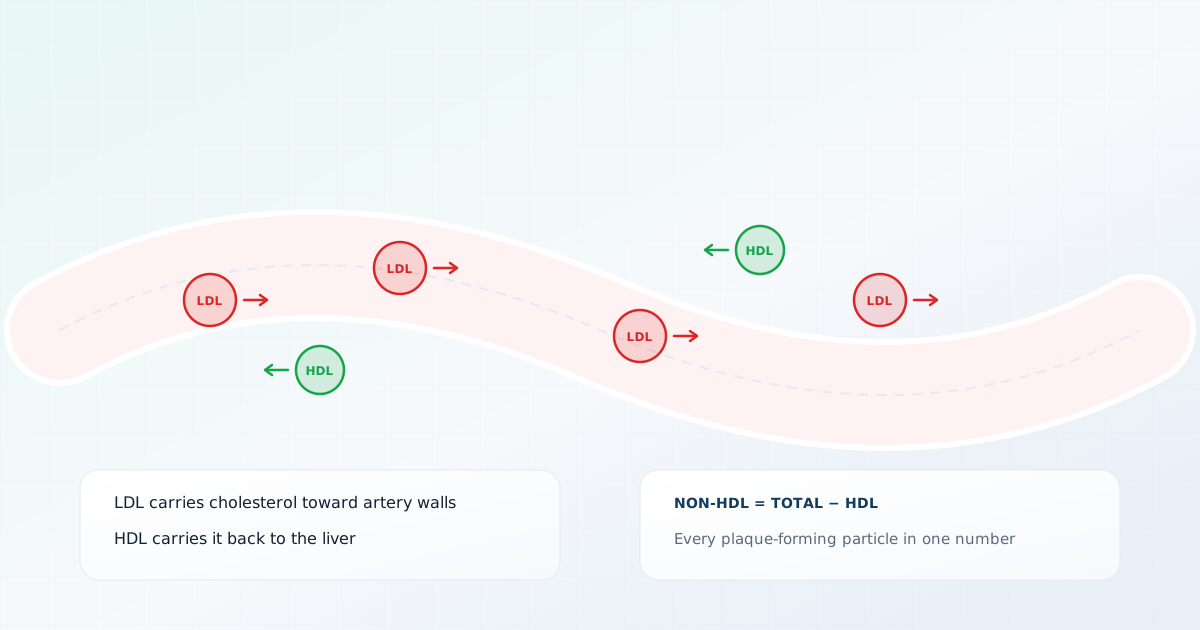
Cholesterol, whether it is reported as total cholesterol, LDL cholesterol or HDL cholesterol, is one molecule with a molar mass of 386.65 grams per mole. That gives a factor of 38.67: one mmol/L of cholesterol equals 38.67 mg/dL. Triglycerides are fats with a much larger molecular mass, and when they are measured as triolein, the standard reference, one mmol/L equals 88.57 mg/dL.
| Measurement | mg/dL to mmol/L | mmol/L to mg/dL |
|---|---|---|
| Total cholesterol | divide by 38.67 | multiply by 38.67 |
| LDL cholesterol | divide by 38.67 | multiply by 38.67 |
| HDL cholesterol | divide by 38.67 | multiply by 38.67 |
| Non-HDL cholesterol | divide by 38.67 | multiply by 38.67 |
| Triglycerides | divide by 88.57 | multiply by 88.57 |
The common mistake
Worked examples
The arithmetic is simple once the factor is right. Take an LDL cholesterol of 3.4 mmol/L from a European report: 3.4 × 38.67 is 131.5 mg/dL. Going the other way, an LDL of 100 mg/dL from a US report is 100 ÷ 38.67, or about 2.59 mmol/L.
It is worth building the habit of checking the result against a sanity test. Because 38.67 is close to 40, a quick estimate for cholesterol is to multiply mmol/L by about 40, so 5 mmol/L is roughly 200 mg/dL. For triglycerides the same mental shortcut is about 90. If a converted figure is far from those rough values, the wrong factor has probably been used, and checking takes seconds.
| mg/dL | mmol/L |
|---|---|
| 70 | 1.81 |
| 100 | 2.59 |
| 130 | 3.36 |
| 190 | 4.91 |
| 200 | 5.17 |
| mg/dL | mmol/L |
|---|---|
| 150 | 1.69 |
| 500 | 5.65 |
Non-HDL cholesterol follows from two other values. A person with total cholesterol of 5.0 mmol/L and HDL of 1.4 mmol/L has non-HDL of 3.6 mmol/L, which is 139.2 mg/dL. The 2026 ACC/AHA guideline sets a non-HDL goal alongside each LDL goal, so the figure is increasingly seen on reports.
Reports from different countries also differ in how many decimal places they print. A European laboratory may print LDL to one decimal place in mmol/L, while a US laboratory prints a whole number in mg/dL. Rounding therefore introduces a small difference when you convert a published value and convert it back, which is another reason to keep the original report and its units alongside any converted figure.
Converting units is not converting guidelines
A converter gives you the same result in a different unit. It cannot tell you whether the result is acceptable, and that is its main limitation, because that depends on which guideline you read it against, and guidelines differ in more than their units.
The 2026 ACC/AHA/Multisociety dyslipidemia guideline, the version in force in the United States, states LDL and non-HDL goals by risk tier in mg/dL. The 2019 ESC/EAS guideline, which many European countries follow, states its targets in mmol/L, and it defines its risk categories differently. They are different frameworks built on different risk models and populations, and neither is a translation of the other.
- An LDL of 2.6 mmol/L converts to 100 mg/dL, but whether either is "on target" depends on the person’s risk category under the guideline their clinician follows.
- Risk is assessed from many factors, including age, blood pressure, diabetes, smoking and family history, and not from the LDL alone.
- Targets are risk-based. Goals for people at higher risk are considerably lower than the general ranges printed on many lab reports.
- A result inside the range on the printed report is not the same thing as a result that meets a personal target.
Read a result against the guideline your clinician uses
Why converted values are still not perfectly comparable
The conversion arithmetic is exact, but the measurements behind it are not perfectly reproducible. The same sample sent to two laboratories can return slightly different values, because every laboratory method has analytical variation and results from different laboratories are not perfectly comparable.
- Fasting and non-fasting samples can differ, particularly for triglycerides, which rise after eating. A comparison between a fasting result and a non-fasting one is not like for like.
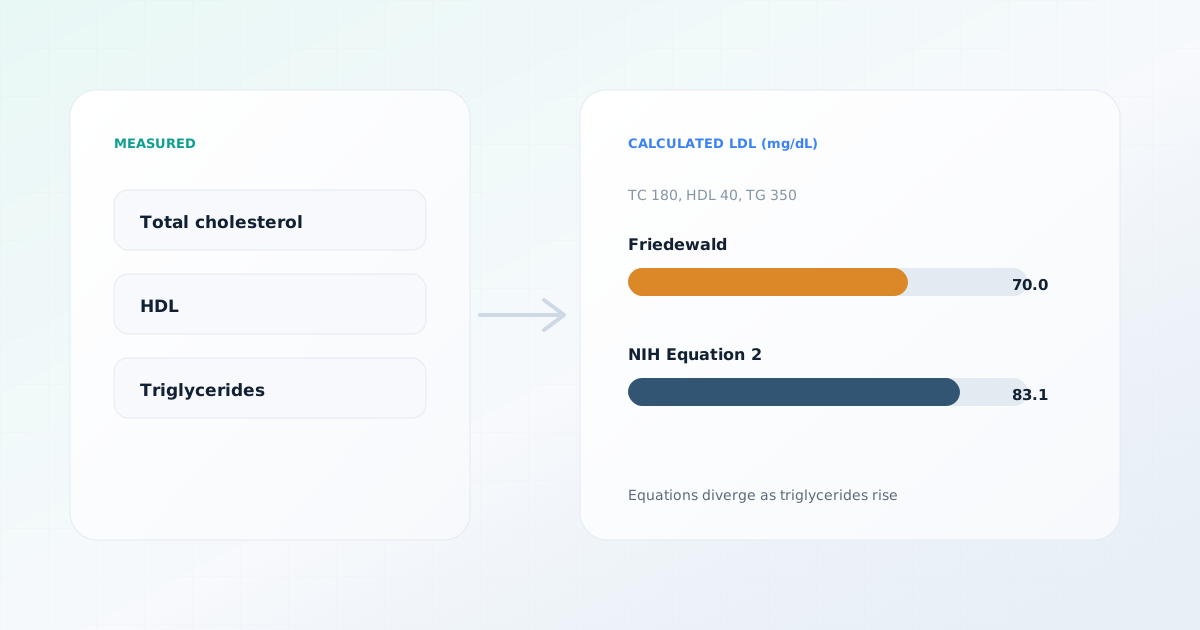
- Most laboratories calculate LDL cholesterol rather than measuring it, using an equation that has its own limits, so the same sample can yield a different LDL depending on the equation the laboratory uses.
- A single reading reflects one day, and lipid values vary from week to week with diet, illness, medicines and other factors.
The sensible way to track change is to compare results from the same laboratory, in the same unit, under similar conditions, and to treat small differences as noise.
A short checklist for reading lipid numbers across systems
- Find the unit printed next to each value, since a bare number is ambiguous.
- Use 38.67 for total, LDL, HDL and non-HDL cholesterol, and 88.57 for triglycerides.
- Check whether the sample was fasting, particularly for triglycerides and any calculated LDL.
- Decide which guideline you want to compare against before judging a number, and use its own units and categories.
- Bring the original report, with units, to any clinician in another system rather than a number you converted.
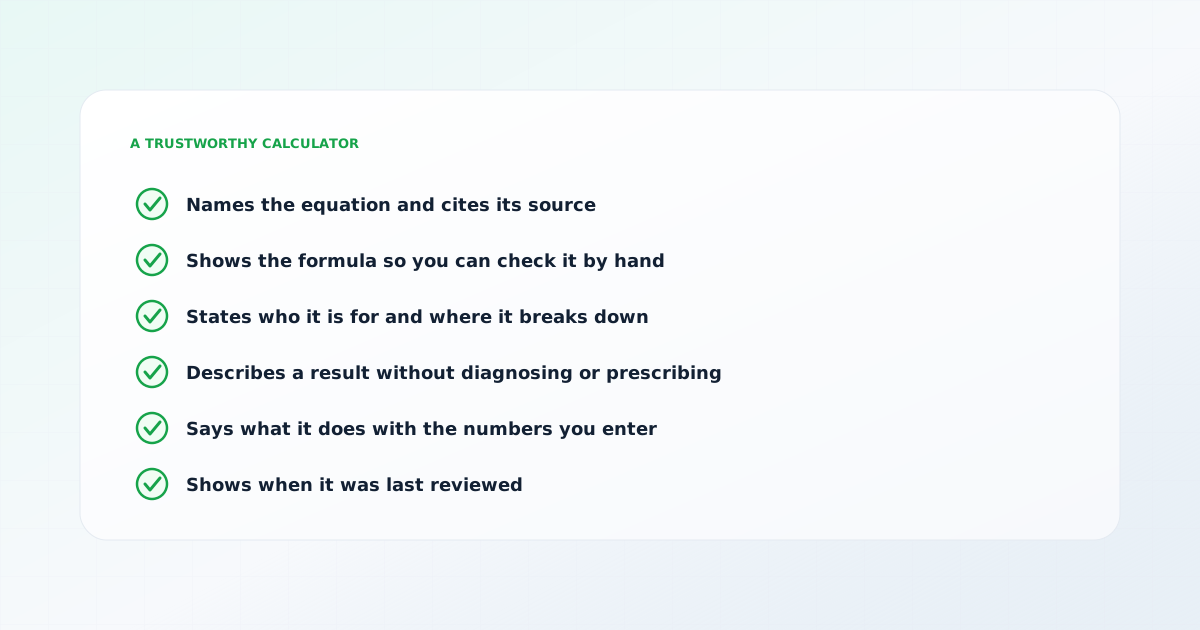
A converter helps you understand a number written in an unfamiliar unit. It does not stand in for a clinician’s interpretation of your overall risk, which is what lipid targets are designed around.
Frequently asked questions
Sources
This page is based on the following sources. Each was reviewed on the access date shown.
- 2026 ACC/AHA/Multisociety Guideline on the Management of Dyslipidemia(opens in a new tab)
Journal of the American College of Cardiology
Clinical guidelinePublished March 13, 2026Accessed October 1, 2026DOI 10.1016/j.jacc.2025.11.016
- 2019 ESC/EAS Guidelines for the management of dyslipidemias(opens in a new tab)
European Heart Journal (European Society of Cardiology)
Clinical guidelinePublished January 1, 2020Accessed September 27, 2026DOI 10.1093/eurheartj/ehz455
- Blood Cholesterol(opens in a new tab)
National Heart, Lung, and Blood Institute (NIH)
Government health agencyAccessed September 27, 2026
- Medical Tests(opens in a new tab)
MedlinePlus (US National Library of Medicine)
Government health agencyAccessed September 27, 2026