What Are Pulse Pressure and Mean Arterial Pressure?
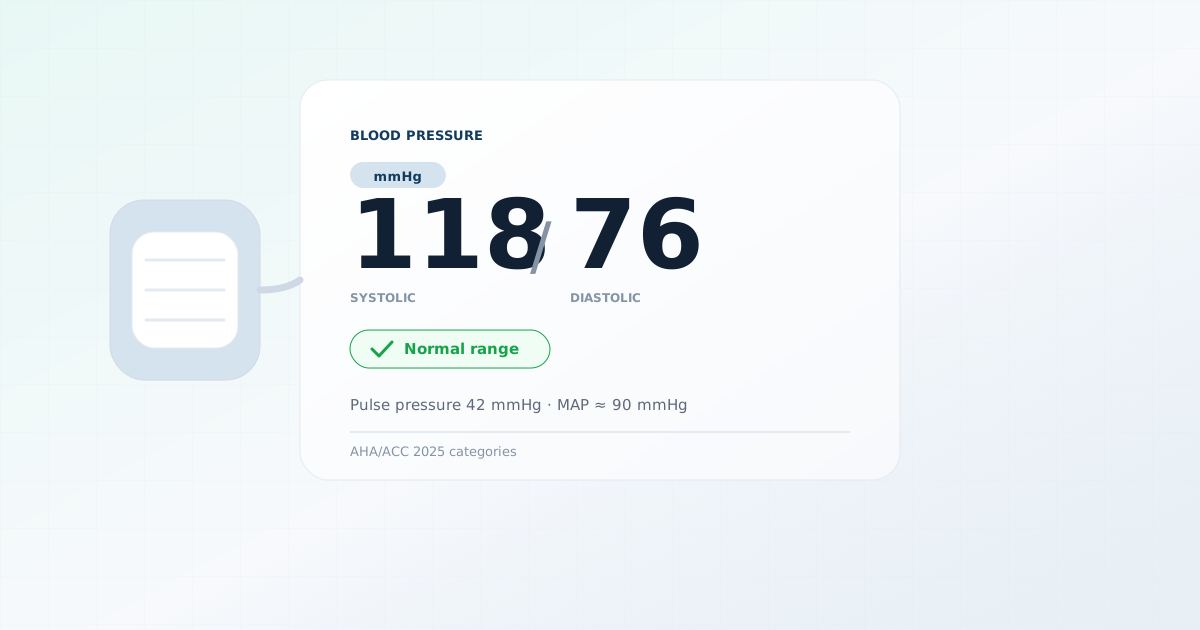
Pulse pressure is the gap between your two blood pressure numbers and reflects large-artery stiffness. Mean arterial pressure is the average pressure across a full heartbeat, and is estimated with a formula that assumes a resting heart rate.
Two numbers derived from one reading
A blood pressure reading gives two values, but several more can be derived from them. Pulse pressure and mean arterial pressure are the two most commonly used, and both come from arithmetic on the systolic and diastolic numbers rather than from any additional measurement.
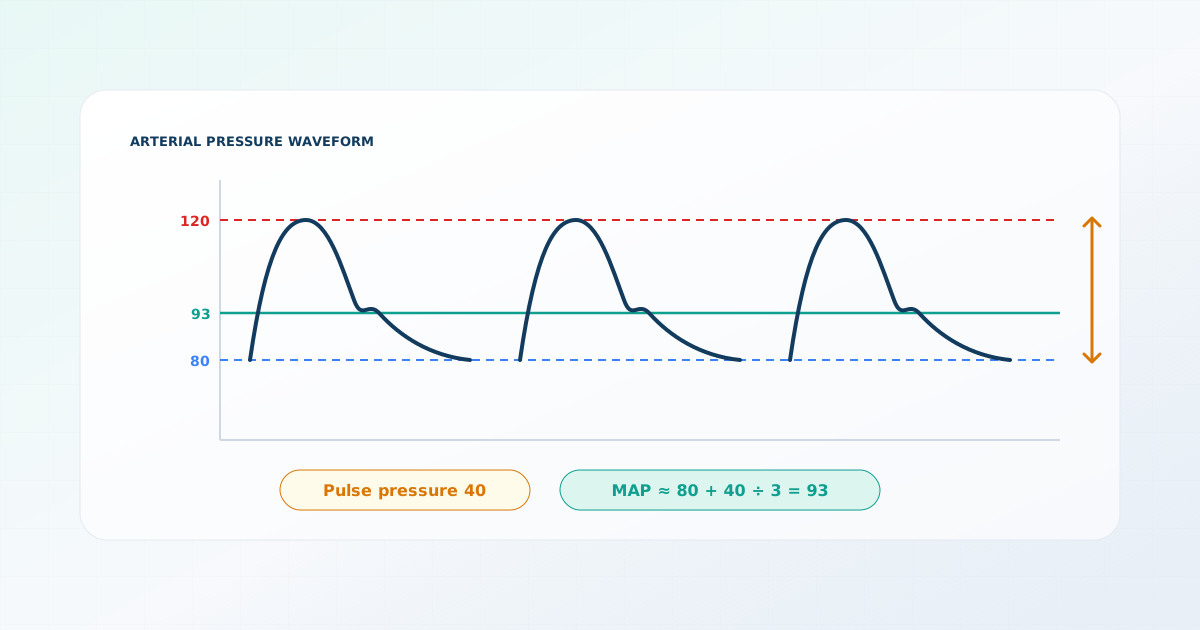
Understanding them starts with the shape of an arterial pressure wave. Pressure in your arteries is not constant: it rises to a peak as the heart contracts, then falls to a trough as the heart relaxes and refills. Systolic pressure is that peak, diastolic pressure is that trough, and everything else is describing the wave between them.
Pulse pressure: the size of the swing
- Pulse pressure
- Systolic pressure minus diastolic pressure — the amount the pressure in your arteries rises and falls with each beat. For a reading of 120/80 mmHg, the pulse pressure is 40 mmHg.
What determines the size of that swing is mainly two things: how much blood the heart ejects with each beat, and how elastic your large arteries are. A young, compliant aorta expands as blood is ejected, absorbing much of the pressure surge and releasing it gradually through diastole. A stiffer aorta cannot expand as much, so more of the surge shows up as a higher systolic peak.
This is why pulse pressure is read primarily as a marker of arterial stiffness, and why it widens with age. Systolic pressure tends to rise through adult life while diastolic pressure plateaus in middle age and often falls thereafter — so the gap grows.
| Pulse pressure | Description |
|---|---|
| Below 30 mmHg | Narrower than typical |
| 30 – 50 mmHg | Typical adult range |
| 51 – 60 mmHg | Upper end of the typical range |
| Above 60 mmHg | Wider than typical |
A narrow pulse pressure is less commonly discussed but also meaningful. It can occur when the heart is ejecting less blood per beat, and in conditions affecting the aortic valve. As with a wide pulse pressure, it is a signal to look further rather than a finding in itself.
It is worth seeing how pulse pressure typically evolves, because the pattern explains a common source of confusion — why a systolic reading can climb over the years while the diastolic number stays put or even drops. That is not two unrelated changes; it is one change, arterial stiffening, showing up in both numbers at once.
| Life stage | Systolic trend | Diastolic trend | Pulse pressure |
|---|---|---|---|
| Young adulthood | Lower | Lower | Narrower |
| Middle age | Rising | Rising, then plateauing | Widening slowly |
| Older age | Continues rising | Plateaus or falls | Widens more clearly |
One practical consequence: in older adults a falling diastolic number alongside a rising systolic one is not reassuring news partly canceling bad news. Both are expressions of the same underlying change, which is why systolic pressure becomes the stronger predictor of cardiovascular risk with age.
Mean arterial pressure: the average across a beat
Mean arterial pressure is the average pressure in your arteries across one complete cardiac cycle. It matters because it approximates the pressure actually driving blood into your organs, which is why it is the number monitored directly in intensive care and during anesthesia.
The obvious first guess — average the two numbers — is wrong, and understanding why explains the real formula.
Why it is not the midpoint
MAP ≈ diastolic + (systolic − diastolic) ÷ 3
For 120/80 mmHg: the pulse pressure is 40, a third of that is 13.3, and adding it to 80 gives a MAP of about 93 mmHg. Notice this is well below the midpoint of 100 — exactly the effect of weighting diastole.
Try the calculatorCalculate pulse pressure and MAP from a readingWhere the MAP formula breaks down
The one-third assumption is the formula’s weak point, and it is worth being explicit about, because it fails in a clinically inconvenient direction.
As heart rate rises, diastole shortens much more than systole does. The heart cannot meaningfully speed up its contraction, so at a high heart rate the proportion of each cycle spent in systole grows — and the assumption that systole occupies a third becomes progressively less true. At a heart rate of 150, the split is much closer to even, and the standard formula underestimates MAP.
Least reliable when it matters most
A directly measured MAP is obtained by a monitor integrating the area under the entire pressure waveform, which requires no assumption about timing at all. It can differ noticeably from the estimate.
What these numbers are actually used for
Neither number is part of routine outpatient blood pressure assessment. The 2025 AHA/ACC guideline categorizes blood pressure using the systolic and diastolic values, and treatment decisions follow from those plus an overall cardiovascular risk estimate from PREVENT — which takes neither pulse pressure nor MAP as an input. The two occupy different niches.
- MAP is used clinically where perfusion pressure is the concern — intensive care, anesthesia, and the management of shock — and is measured directly in those settings.
- Pulse pressure appears mainly in research, as a marker of arterial stiffness in epidemiological cohorts. Studies have found associations with cardiovascular outcomes, particularly in older adults.
- Both are useful for understanding *why* blood pressure behaves as it does — for instance, why systolic pressure rises with age while diastolic does not.
That last point is the main reason they are worth understanding as a reader rather than a clinician. They make the physiology legible. Knowing that pulse pressure reflects arterial elasticity explains a pattern that otherwise looks arbitrary.
Try the calculatorCheck the underlying reading against the 2025 AHA/ACC categoriesLimitations of both numbers
- Both are derived from a blood pressure reading and inherit every one of its limitations — measurement technique, cuff size, arm position, and normal daily variation.
- The MAP formula assumes a resting heart rate and becomes progressively less accurate as heart rate rises.
- A calculated MAP is not interchangeable with a directly measured one.
- Pulse pressure widens naturally with age. A value outside the typical range is not by itself evidence of disease.
- Pulse pressure can be misleading in aortic valve disease, severe anemia, an overactive thyroid, and at very low or very high heart rates.
- Neither number has an established diagnostic threshold, and neither should be interpreted without the underlying blood pressure reading and clinical context.
Do not act on these numbers alone
Frequently asked questions
Sources
This page is based on the following sources. Each was reviewed on the access date shown.
- Systolic and diastolic blood pressure, pulse pressure, and mean arterial pressure as predictors of cardiovascular disease risk in men(opens in a new tab)
Hypertension (American Heart Association)
Observational studyPublished November 1, 2000Accessed September 27, 2026
- 2025 AHA/ACC Guideline for the Prevention, Detection, Evaluation and Management of High Blood Pressure in Adults(opens in a new tab)
Circulation (American Heart Association)
Clinical guidelinePublished August 14, 2025Accessed October 1, 2026DOI 10.1161/CIR.0000000000001356
- High Blood Pressure(opens in a new tab)
National Heart, Lung, and Blood Institute (NIH)
Government health agencyAccessed September 27, 2026
- 2024 ESC Guidelines for the management of elevated blood pressure and hypertension(opens in a new tab)
European Heart Journal (European Society of Cardiology)
Clinical guidelinePublished October 7, 2024Accessed September 27, 2026DOI 10.1093/eurheartj/ehae178