What Sleep Trackers Actually Measure
A wrist tracker measures movement and pulse, then infers sleep from them. Total sleep time comes out reasonably well; the stage percentages are estimates from an algorithm that never observed your brain, and no consumer device diagnoses a sleep disorder.
What the device on your wrist actually records
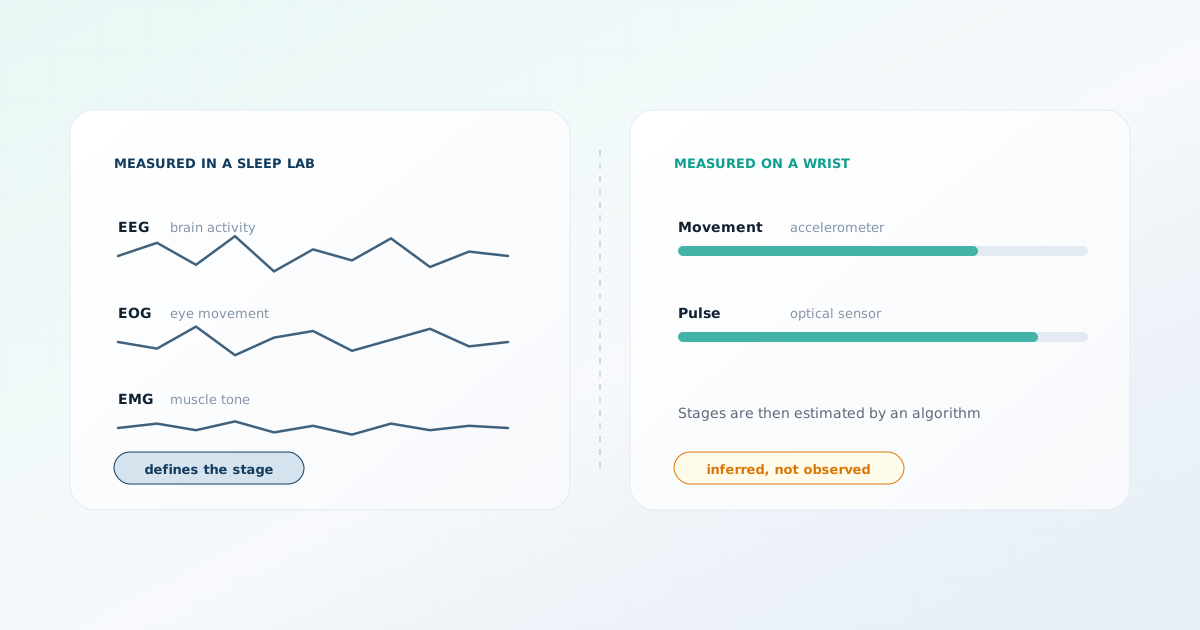
A consumer sleep tracker has, in almost all cases, two sensors relevant to sleep. An accelerometer records movement. An optical sensor shines light into the skin and measures how much comes back, which tracks the pulse in the small blood vessels underneath — photoplethysmography. Some devices add skin temperature or blood oxygen saturation.
Nothing in that list is a measurement of sleep. Movement and heart rate are correlates of sleep, and the device infers sleep from them using an algorithm the manufacturer does not usually publish. The number you read in the morning is the output of a model, not a reading from an instrument.
- Actigraphy
- Estimating sleep and wake from movement recorded over time. It has a long research history and is a legitimate method with known limits, the principal one being that it infers state from stillness.
Why the algorithms are undisclosed
What sleep stages are defined by
Sleep stages are not defined by how still you are or how slow your pulse is. They are defined by patterns of electrical activity in the brain, together with eye movement and muscle tone. Measuring them requires electrodes: an electroencephalogram for brain activity, an electro-oculogram for eye movement, and an electromyogram for muscle tone.
| Signal | What it establishes | On a consumer wearable? |
|---|---|---|
| Brain activity (EEG) | The stage itself — N1, N2, N3 and REM are defined by it | No |
| Eye movement (EOG) | Distinguishes REM from other stages | No |
| Muscle tone (EMG) | The muscle atonia characteristic of REM | No |
| Airflow and effort | Breathing pauses, as in sleep apnea | No |
| Movement | A correlate of wakefulness | Yes |
| Pulse and its variability | A correlate of autonomic state | Yes |
This is the central point about stage percentages. A device reporting that you had 54 minutes of deep sleep did not observe deep sleep. It observed that you were still and that your pulse behaved in a particular way, and its model associates that combination with deep sleep in the population the model was built on.
Which outputs are worth something, and which are not
The outputs are not uniformly unreliable. They form a fairly clear hierarchy, and knowing where each number sits is most of what makes a tracker useful rather than misleading.
| Output | Confidence | Why |
|---|---|---|
| Time in bed | High | Essentially a clock reading |
| Sleep and wake timing | Reasonable | The transitions are usually marked by clear movement changes |
| Total sleep time | Reasonable, biased upward | Quiet wakefulness tends to be scored as sleep |
| Night-to-night trend in your own data | Reasonable | A consistent method compared against itself |
| Awakenings count | Low | Brief arousals are routinely missed |
| Stage percentages | Low | Inferred from signals that do not define stages |
| A single composite "sleep score" | Low | An undisclosed weighting of the rows above |
The upward bias on total sleep time has a specific cause worth understanding. Movement-based scoring distinguishes stillness from motion, and someone lying awake in the dark is still. Devices therefore tend to detect sleep well and detect wakefulness poorly — which matters most for exactly the people most likely to be looking, because a central feature of insomnia is lying awake without moving.
A tracker is least accurate where it is most used
Heart rate variability and recovery scores
Many devices report overnight heart rate variability — the variation in time between consecutive heartbeats — and fold it into a recovery or readiness score. Heart rate variability is a real physiological measurement, and in general a higher overnight value in your own data is associated with a more rested state.
It is also a measurement with no useful population reference range. Values differ enormously between people for reasons including age, fitness and anatomy, so comparing your figure with someone else’s says very little. It is a within-person signal, and only interpretable against your own established baseline.
- Alcohol in the evening reliably lowers overnight heart rate variability and raises resting heart rate, often more than people expect.
- A late or large meal, heat, dehydration and a hard training session the previous day all move it in the same direction.
- An infection coming on frequently shows up as a change before symptoms do — which is suggestive rather than diagnostic.
- The measurement method differs between devices, so values from two brands are not comparable even on the same night.
A recovery score built on these inputs is a reasonable prompt to consider taking a lighter day. It is not a measurement of whether you are recovered, and it has no ability to distinguish between the several things that could have produced it.
What a tracker cannot do
The American Academy of Sleep Medicine published a position statement on consumer sleep technology stating that these devices are not a substitute for medical evaluation and are not cleared to diagnose sleep disorders. The statement also allows that they can have a constructive role in the conversation between a patient and a clinician, which is a more balanced position than outright dismissal.
Sleep apnea needs a validated test
Some wearables have received regulatory clearance for specific, narrow functions, such as flagging possible breathing disturbances or detecting an irregular rhythm suggestive of atrial fibrillation. A cleared feature of that kind is a prompt to seek assessment, and it is not equivalent to a diagnostic test for a sleep disorder.
When tracking makes sleep worse
Clinicians have described a pattern in which the pursuit of better numbers itself damages sleep. A 2017 case series in the Journal of Clinical Sleep Medicine named it orthosomnia: patients who presented with sleep complaints driven substantially by their tracker data, some of whom spent longer in bed trying to improve a score and slept worse as a result.
The mechanism is not mysterious. Anxiety about falling asleep interferes with falling asleep, and a device that assigns a nightly grade gives that anxiety something to attach to. Checking a score on waking also frames the day before anything has happened in it.
- Treat the weekly trend as the unit of information and ignore individual nights.
- Prefer the simple duration and timing figures over the composite score, since they are the ones the device measures most directly.
- If a poor score changes how you feel about a day that was otherwise fine, that is a reason to stop looking at it in the morning.
- If tracking has become a source of worry about sleep, stopping for a few weeks is a reasonable experiment and costs nothing.
How you feel is the outcome that matters
Frequently asked questions
Sources
This page is based on the following sources. Each was reviewed on the access date shown.
- Consumer Sleep Technology: An American Academy of Sleep Medicine Position Statement(opens in a new tab)
Journal of Clinical Sleep Medicine (American Academy of Sleep Medicine)
Professional societyPublished May 15, 2018Accessed October 1, 2026DOI 10.5664/jcsm.7128
- Sleep Phases and Stages(opens in a new tab)
National Heart, Lung, and Blood Institute (NIH)
Government health agencyAccessed October 1, 2026
- Orthosomnia: Are Some Patients Taking the Quest for Perfect Sleep Too Far?(opens in a new tab)
Journal of Clinical Sleep Medicine (American Academy of Sleep Medicine)
Peer-reviewed articlePublished February 15, 2017Accessed October 1, 2026DOI 10.5664/jcsm.6472
- About Sleep(opens in a new tab)
Centers for Disease Control and Prevention
Government health agencyAccessed October 1, 2026